AT&T Wireless 2008 Annual Report Download - page 53
Download and view the complete annual report
Please find page 53 of the 2008 AT&T Wireless annual report below. You can navigate through the pages in the report by either clicking on the pages listed below, or by using the keyword search tool below to find specific information within the annual report.-
 1
1 -
2
-
3
-
4
-
5
-
6
-
7
-
8
-
9
-
10
-
11
-
12
-
13
-
14
-
15
-
16
-
17
-
18
-
19
-
20
-
21
-
22
-
23
-
24
-
25
-
26
-
27
-
28
-
29
-
30
-
31
-
32
-
33
-
34
-
35
-
36
-
37
-
38
-
39
-
40
-
41
-
42
-
 43
43 -
 44
44 -
 45
45 -
 46
46 -
 47
47 -
 48
48 -
 49
49 -
 50
50 -
 51
51 -
 52
52 -
 53
53 -
 54
54 -
 55
55 -
 56
56 -
 57
57 -
 58
58 -
 59
59 -
 60
60 -
 61
61 -
 62
62 -
 63
63 -
64
-
65
-
66
-
67
-
68
-
69
-
70
-
71
-
72
-
73
-
74
-
75
-
76
-
77
-
78
-
79
-
80
-
81
-
82
-
83
-
84
 |
 |

AT&T Annual Report 2008
| 51
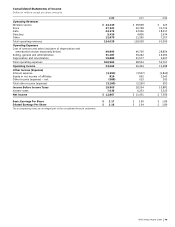
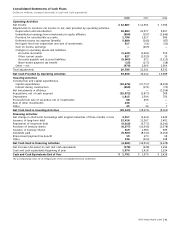
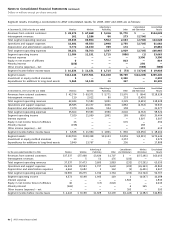
Consolidated Statements of Cash Flows
Dollars in millions, increase (decrease) in cash and cash equivalents
2008 2007 2006
Operating Activities
Net income $ 12,867 $ 11,951 $ 7,356
Adjustments to reconcile net income to net cash provided by operating activities:
Depreciation and amortization 19,883 21,577 9,907
Undistributed earnings from investments in equity affiliates (654) (297) (1,946)
Provision for uncollectible accounts 1,796 1,617 586
Deferred income tax expense (benefit) 5,889 (240) (87)
Net (gain) loss from impairment and sale of investments 517 (11) (10)
Gain on license exchange — (409) —
Changes in operating assets and liabilities:
Accounts receivable (1,421) (1,491) 519
Other current assets 827 (1,020) 30
Accounts payable and accrued liabilities (5,563) 672 (2,213)
Share-based payment tax benefit (15) (173) (18)
Other – net (470) 2,066 1,564
Total adjustments 20,789 22,291 8,332
Net Cash Provided by Operating Activities 33,656 34,242 15,688
Investing Activities
Construction and capital expenditures:
Capital expenditures (19,676) (17,717) (8,320)
Interest during construction (659) (171) (73)
Net investments in affiliates — — (1,104)
Acquisitions, net of cash acquired (10,972) (2,873) 368
Dispositions 1,615 1,594 756
Proceeds from sale of securities, net of investments 68 455 —
Sale of other investments 436 — —
Other 45 36 7
Net Cash Used in Investing Activities (29,143) (18,676) (8,366)
Financing Activities
Net change in short-term borrowings with original maturities of three months or less 2,017 (3,411) 3,649
Issuance of long-term debt 12,416 11,367 1,491
Repayment of long-term debt (4,010) (6,772) (4,242)
Purchase of treasury shares (6,077) (10,390) (2,678)
Issuance of treasury shares 319 1,986 589
Dividends paid (9,507) (8,743) (5,153)
Share-based payment tax benefit 15 173 18
Other 136 (224) 198
Net Cash Used in Financing Activities (4,691) (16,014) (6,128)
Net increase (decrease) in cash and cash equivalents (178) (448) 1,194
Cash and cash equivalents beginning of year 1,970 2,418 1,224
Cash and Cash Equivalents End of Year $ 1,792 $ 1,970 $ 2,418
The accompanying notes are an integral part of the consolidated financial statements.