AT&T Wireless 2008 Annual Report Download - page 73
Download and view the complete annual report
Please find page 73 of the 2008 AT&T Wireless annual report below. You can navigate through the pages in the report by either clicking on the pages listed below, or by using the keyword search tool below to find specific information within the annual report.-
 1
1 -
2
-
3
-
4
-
5
-
6
-
7
-
8
-
9
-
10
-
11
-
12
-
13
-
14
-
15
-
16
-
17
-
18
-
19
-
20
-
21
-
22
-
23
-
24
-
25
-
26
-
27
-
28
-
29
-
30
-
31
-
32
-
33
-
34
-
35
-
36
-
37
-
38
-
39
-
40
-
41
-
42
-
43
-
44
-
45
-
46
-
47
-
48
-
49
-
50
-
51
-
52
-
53
-
54
-
55
-
56
-
57
-
58
-
59
-
60
-
61
-
62
-
 63
63 -
 64
64 -
 65
65 -
 66
66 -
 67
67 -
 68
68 -
 69
69 -
 70
70 -
 71
71 -
 72
72 -
 73
73 -
 74
74 -
 75
75 -
 76
76 -
 77
77 -
 78
78 -
 79
79 -
 80
80 -
 81
81 -
 82
82 -
 83
83 -
84
 |
 |

AT&T Annual Report 2008
| 71
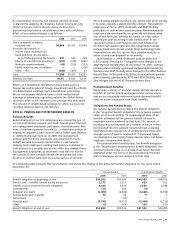
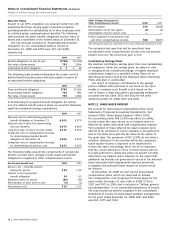
The following table provides information for our
supplemental retirement plans with accumulated benefit
obligations in excess of plan assets:
2008 2007
Projected benefit obligation $(2,114) $(2,301)
Accumulated benefit obligation (2,023) (2,155)
Fair value of plan assets — —
The following tables present the components of net periodic
benefit cost and other changes in plan assets and benefit
obligations recognized in other comprehensive income:
Net Periodic Benefit Cost 2008 2007
Service cost – benefits earned
during the period $ 13 $ 16
Interest cost on projected
benefit obligation 141 147
Amortization of prior service cost 6 6
Recognized actuarial loss 21 27
Net supplemental retirement pension cost $181 $196
Other Changes Recognized in
Other Comprehensive Income1 2008 2007
Net loss (gain) $(66) $(60)
Prior service cost (credit) — 11
Amortization of net loss (gain) 11 15
Amortization of prior service cost 4 3
Total recognized in net supplemental
pension cost and other
comprehensive income $(51) $(31)
1FAS 158 required prospective application for fiscal years ending after December 15, 2006.
The estimated net loss and prior service cost for our
supplemental retirement plan benefits that will be amortized
from accumulated other comprehensive income into net
periodic benefit cost over the next fiscal year are $11 and
$5, respectively.
Deferred compensation expense was $54 in 2008, $106 in
2007 and $39 in 2006. Our deferred compensation liability,
included in “Other noncurrent liabilities,” was $1,054 at
December 31, 2008, and $1,116 at December 31, 2007.
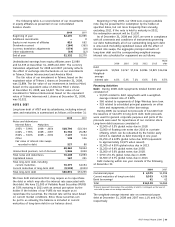
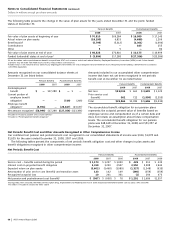
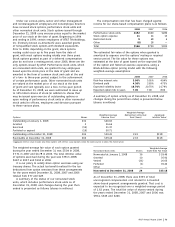
Estimated Future Benefit Payments
Expected benefit payments are estimated using the same
assumptions used in determining our benefit obligation at
December 31, 2008. Because benefit payments will depend
on future employment and compensation levels, average
years employed and average life spans, among other factors,
changes in any of these factors could significantly affect
these expected amounts. The following table provides
expected benefit payments under our pension and
postretirement plans:
Medicare
Pension Postretirement Subsidy
Benefits Benefits Receipts
2009 $ 5,018 $ 2,588 $ (121)
2010 4,713 2,686 (131)
2011 4,655 2,769 (140)
2012 4,583 2,794 (155)
2013 4,484 2,819 (170)
Years 2014 – 2018 20,777 14,180 (1,086)
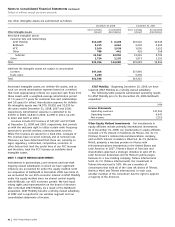
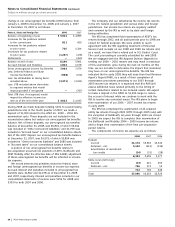
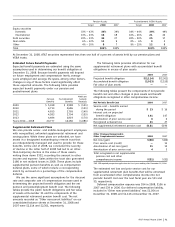
Supplemental Retirement Plans
We also provide senior- and middle-management employees
with nonqualified, unfunded supplemental retirement and
savings plans. While these plans are unfunded, we have
assets in a designated nonbankruptcy remote trust that
are independently managed and used to provide for these
benefits. At the end of 2008, we concluded the severity
of decline in the latter half of 2008 had led to an other-
than-temporary decline in the value of these assets,
writing them down $332, recording the amount in other
income and expense. Sales within the trust also generated
$180 in net realized losses in 2008. These plans include
supplemental pension benefits as well as compensation
deferral plans, some of which include a corresponding
match by us based on a percentage of the compensation
deferral.
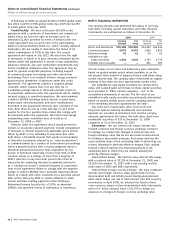
We use the same significant assumptions for the discount
rate and composite rate of compensation increase used in
determining the projected benefit obligation and the net
pension and postemployment benefit cost. The following
tables provide the plans’ benefit obligations and fair value
of assets at December 31 and the components of the
supplemental retirement pension benefit cost. The net
amounts recorded as “Other noncurrent liabilities” on our
consolidated balance sheets at December31, 2008 and
2007 were $2,114 and $2,301, respectively.
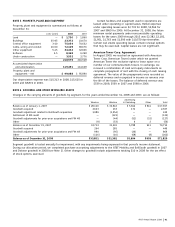
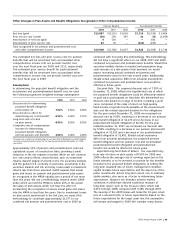
Pension Assets Postretirement (VEBA) Assets
Target 2008 2007 Target 2008 2007
Equity securities
Domestic 33% – 43% 34% 39% 34% – 44% 39% 49%
International 13% – 23% 16 18 16% – 26% 21 24
Debt securities 23% – 33% 30 27 20% – 30% 25 17
Real estate 6% – 12% 11 9 0% – 6% 3 2
Other 4% – 10% 9 7 9% – 15% 12 8
Total 100% 100% 100% 100%
At December 31, 2008, AT&T securities represented less than one half of a percent of assets held by our pension plans and
VEBA trusts.