AT&T Wireless 2008 Annual Report Download - page 30
Download and view the complete annual report
Please find page 30 of the 2008 AT&T Wireless annual report below. You can navigate through the pages in the report by either clicking on the pages listed below, or by using the keyword search tool below to find specific information within the annual report.-
 1
1 -
2
-
3
-
4
-
5
-
6
-
7
-
8
-
9
-
10
-
11
-
12
-
13
-
14
-
15
-
16
-
17
-
18
-
19
-
 20
20 -
 21
21 -
 22
22 -
 23
23 -
 24
24 -
 25
25 -
 26
26 -
 27
27 -
 28
28 -
 29
29 -
 30
30 -
 31
31 -
 32
32 -
 33
33 -
 34
34 -
 35
35 -
 36
36 -
 37
37 -
 38
38 -
 39
39 -
 40
40 -
41
-
42
-
43
-
44
-
45
-
46
-
47
-
48
-
49
-
50
-
51
-
52
-
53
-
54
-
55
-
56
-
57
-
58
-
59
-
60
-
61
-
62
-
63
-
64
-
65
-
66
-
67
-
68
-
69
-
70
-
71
-
72
-
73
-
74
-
75
-
76
-
77
-
78
-
79
-
80
-
81
-
82
-
83
-
84
 |
 |

28
| AT&T Annual Report 2008
Management’s Discussion and Analysis of Financial Condition and Results of Operations (continued)
Dollars in millions except per share amounts
Cost of services declined $206 in 2007. This decline
was due to lower interconnect, roaming and long-distance
expenses related to network and systems integration and
cost-reduction initiatives, as well as cost reductions from
the migration of network usage from the T-Mobile network.
These decreases were partially offset by higher network
usage, with increases in total system minutes of use of
13.5%, and associated network system expansion and
increased network equipment costs.
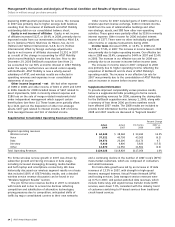
Selling, general and administrative expenses increased
$1,809, or 14.4%, in 2008 and $1,148, or 10.0%, in 2007.
The increase in selling, general and administrative expenses
in 2008 was due to the following:
• Increasesof$702incustomercostsandotherexpenses
primarily due to increased customer service costs of
$159, customer maintenance costs of $240, bad debt
expense of $49 and other support costs of $298,
partially offset by a decline of $44 in billing expenses.
• Increasesinsellingexpensesof$362duetoincreasesin
commissions expense, sales and marketing expenses partly
attributable to the introduction of the Apple iPhone 3G.
• Increasesinupgradecommissionandresidualexpenses
of $745 due to higher handset upgrade volume and
commission rates.
The increase in selling, general and administrative expenses
in 2007 was due to the following:
• Increasesinsellingexpensesof$572duetoincreasesin
sales and advertising expenses and Apple iPhone related
costs, partially offset by a decrease in net commission
expense, which was consistent with the increase in
prepaid plan sales as a percentage of total retail sales.
• Increasesof$572incustomermaintenanceandother
expenses primarily due to increased bad debt expense of
$338 and other support costs of $234, partially offset by
a decline of $191 in billing expenses, lower information
technology (IT) and customer service expenses.
• Increasesinupgradecommissionandresidualexpenses
of $195 due to increased prepaid plan costs and higher
handset upgrade activity.
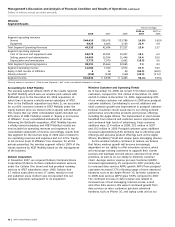
Depreciation and amortization decreased $1,309,
or 18.5%, in 2008 and increased $617, or 9.5%, in 2007.
The decrease in 2008 was due to lower amortization
expense of $770 and lower depreciation expense of $539.
The decrease in amortization expense is attributable to
declining amortization of identifiable intangible assets,
which are principally amortized using the sum-of-the-
months-digits method of amortization, partially offset by
incremental amortization on Dobson intangible assets
acquired by AT&T Mobility. Depreciation expense
decreased $695 due to certain network assets becoming
fully depreciated and decreased $612 due to Time Division
Multiple Access (TDMA) assets being depreciated on an
accelerated basis through 2007. These decreases were
partly offset by incremental depreciation on capital assets
placed in service during 2008.
The increase in 2007 was primarily due to an increase of
$1,522 in amortization of identifiable intangible assets related
to our acquisition of BellSouth’s 40% ownership interest,
partially offset by declining amortization of identifiable AT&T
Wireless Services, Inc. intangible assets acquired by AT&T
Mobility in 2004. Expenses also increased due to accelerated
depreciation on TDMA assets and ongoing capital spending
for network upgrades and expansion. The 2007 increase
was partially offset by decreases in depreciation expense
of $905 due to certain network assets becoming fully
depreciated and purchase accounting adjustments on
certain network assets related to acquiring BellSouth’s
40% ownership interest of AT&T Mobility.
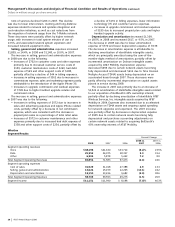
Wireline
Segment Results
Percent Change
2008 vs. 2007 vs.
2008 2007 2006 2007 2006
Segment operating revenues
Voice $38,198 $41,630 $33,714 (8.2)% 23.5%
Data 25,352 24,075 18,317 5.3 31.4
Other 6,304 5,878 5,442 7.2 8.0
Total Segment Operating Revenues 69,854 71,583 57,473 (2.4) 24.6
Segment operating expenses
Cost of sales 31,929 31,018 27,388 2.9 13.3
Selling, general and administrative 13,624 15,159 12,205 (10.1) 24.2
Depreciation and amortization 13,150 13,416 9,682 (2.0) 38.6
Total Segment Operating Expenses 58,703 59,593 49,275 (1.5) 20.9
Segment Income $11,151 $11,990 $ 8,198 (7.0)% 46.3%