AT&T Wireless 2008 Annual Report Download - page 47
Download and view the complete annual report
Please find page 47 of the 2008 AT&T Wireless annual report below. You can navigate through the pages in the report by either clicking on the pages listed below, or by using the keyword search tool below to find specific information within the annual report.-
 1
1 -
2
-
3
-
4
-
5
-
6
-
7
-
8
-
9
-
10
-
11
-
12
-
13
-
14
-
15
-
16
-
17
-
18
-
19
-
20
-
21
-
22
-
23
-
24
-
25
-
26
-
27
-
28
-
29
-
30
-
31
-
32
-
33
-
34
-
35
-
36
-
 37
37 -
 38
38 -
 39
39 -
 40
40 -
 41
41 -
 42
42 -
 43
43 -
 44
44 -
 45
45 -
 46
46 -
 47
47 -
 48
48 -
 49
49 -
 50
50 -
 51
51 -
 52
52 -
 53
53 -
 54
54 -
 55
55 -
 56
56 -
 57
57 -
58
-
59
-
60
-
61
-
62
-
63
-
64
-
65
-
66
-
67
-
68
-
69
-
70
-
71
-
72
-
73
-
74
-
75
-
76
-
77
-
78
-
79
-
80
-
81
-
82
-
83
-
84
 |
 |

AT&T Annual Report 2008
| 45
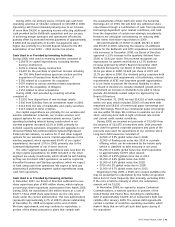
Total Number of Maximum Number
Shares Purchased as of Shares that May
Part of Publicly Yet Be Purchased
Total Number of Average Price Announced Plans Under the Plans
Purchase Period Shares Purchased Paid per Share1 or Programs or Programs
January 30, 2008 – January 31, 2008 10,000,000 $35.70 10,000,000 390,000,000
February 1, 2008 – February 29, 2008 77,133,333 $36.78 77,133,333 312,866,667
March 3, 2008 – March 31, 2008 24,500,000 $35.77 24,500,000 288,366,667
May 6, 2008 – May 30, 2008 23,700,000 $39.38 23,700,000 264,666,667
June 2, 2008 – June 30, 2008 28,900,000 $37.08 28,900,000 235,766,667
Total 164,233,333 $36.99 164,233,333 235,766,667
1Average Price Paid per Share excludes transaction costs.
STOCK PER FOR M A NCE GRAPH
Comparison of Five-Year Cumulative Total Return
AT&T Inc., S&P 500 Index, and S&P 500 Integrated Telecom Index
200
190
180
170
160
150
140
130
120
110
100
90
80
70
12/03 12/04 12/05 12/06 12/07 12/08
100
114
109
163
193
145
138
192
159
104 104
90
142
135
116
111
S&P 500 Integrated
Telecom Index
AT&T Inc. S&P 500 Index
The comparison above assumes $100 invested on December31, 2003, in AT&T common stock, Standard& Poor’s 500 Index
(S&P 500), and Standard & Poor’s 500 Integrated Telecom Index (Telecom Index). Total return equals stock price appreciation plus
reinvestment of dividends on a quarterly basis.
Issuer Equity Repurchases
On December 10, 2007, our Board of Directors authorized
a new share repurchase plan of 400 million shares, which
replaces our previous share repurchase authorization.
During 2008, we repurchased 164 million shares at a cost
of $6,077. This new authorization represents approximately
6.7% of AT&T’s shares outstanding at December 31, 2008,
and expires at the end of 2009. We may continue to
repurchase, a portion of the shares pursuant to plans that
comply with the requirements of Rule 10b5-1(c) under the
Securities Exchange Act of 1934. We will fund any share
repurchases through a combination of cash from operations,
borrowings dependent upon market conditions and cash
from the disposition of certain non-strategic investments
but anticipate concentrating on reducing debt levels rather
than share repurchases in 2009.