AT&T Wireless 2008 Annual Report Download - page 54
Download and view the complete annual report
Please find page 54 of the 2008 AT&T Wireless annual report below. You can navigate through the pages in the report by either clicking on the pages listed below, or by using the keyword search tool below to find specific information within the annual report.-
 1
1 -
2
-
3
-
4
-
5
-
6
-
7
-
8
-
9
-
10
-
11
-
12
-
13
-
14
-
15
-
16
-
17
-
18
-
19
-
20
-
21
-
22
-
23
-
24
-
25
-
26
-
27
-
28
-
29
-
30
-
31
-
32
-
33
-
34
-
35
-
36
-
37
-
38
-
39
-
40
-
41
-
42
-
43
-
 44
44 -
 45
45 -
 46
46 -
 47
47 -
 48
48 -
 49
49 -
 50
50 -
 51
51 -
 52
52 -
 53
53 -
 54
54 -
 55
55 -
 56
56 -
 57
57 -
 58
58 -
 59
59 -
 60
60 -
 61
61 -
 62
62 -
 63
63 -
 64
64 -
65
-
66
-
67
-
68
-
69
-
70
-
71
-
72
-
73
-
74
-
75
-
76
-
77
-
78
-
79
-
80
-
81
-
82
-
83
-
84
 |
 |

52
| AT&T Annual Report 2008
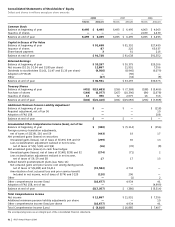
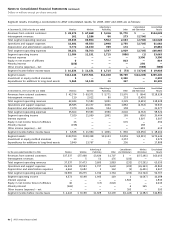
Consolidated Statements of Stockholders’ Equity
Dollars and shares in millions except per share amounts
2008 2007 2006
Shares Amount Shares Amount Shares Amount
Common Stock
Balance at beginning of year 6,495 $ 6,495 6,495 $ 6,495 4,065 $ 4,065
Issuance of shares — — — — 2,430 2,430
Balance at end of year 6,495 $ 6,495 6,495 $ 6,495 6,495 $ 6,495
Capital in Excess of Par Value
Balance at beginning of year $ 91,638 $ 91,352 $27,499
Issuance of shares 87 225 63,637
Share-based payment 3 61 216
Balance at end of year $ 91,728 $ 91,638 $91,352
Retained Earnings
Balance at beginning of year $ 33,297 $ 30,375 $29,106
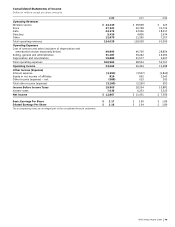
Net income ($2.16, $1.94 and $1.89 per share) 12,867 11,951 7,356
Dividends to stockholders ($1.61, $1.47 and $1.35 per share) (9,506) (8,945) (6,079)
Adoption of FIN 48 — (50) —
Other (67) (34) (8)
Balance at end of year $ 36,591 $ 33,297 $30,375
Treasury Shares
Balance at beginning of year (451) $(15,683) (256) $ (7,368) (188) $ (5,406)
Purchase of shares (164) (6,077) (267) (10,390) (84) (2,678)
Issuance of shares 13 350 72 2,075 16 716
Balance at end of year (602) $(21,410) (451) $(15,683) (256) $ (7,368)
Additional Minimum Pension Liability Adjustment
Balance at beginning of year $ — $ — $ (218)
Required adjustment, net of tax $6 — — 10
Adoption of FAS 158 — — 208
Balance at end of year $ — $ — $ —
Accumulated Other Comprehensive Income (Loss), net of tax
Balance at beginning of year $ (380) $ (5,314) $ (356)
Foreign currency translation adjustments,
net of taxes of $(239), $10 and $9 (443) 19 17
Net unrealized gains (losses) on securities:
Unrealized gains (losses), net of taxes of $(139), $35 and $7 (259) 65 13
Less reclassification adjustment realized in net income,
net of taxes of $(9), $(19) and $(4) (16) (35) (8)
Net unrealized gains (losses) on cash flow hedges:
Unrealized gains (losses), net of taxes of $(148), $(38) and $2 (274) (71) 2
Less reclassification adjustment realized in net income,
net of taxes of $9, $9 and $8 17 17 15
Defined benefit postretirement plans (see Note 11):
Net actuarial gains and prior service cost arising during period,
net of taxes of $(9,298) and $3,411 (15,582) 4,734 —
Amortization of net actuarial loss and prior service benefit
Included in net income, net of taxes of $(74) and $125 (120) 206 —
Other — (1) 2
Other comprehensive income (loss) (16,677) 4,934 41
Adoption of FAS 158, net of tax — — (4,999)
Balance at end of year $(17,057) $ (380) $ (5,314)
Total Comprehensive Income
Net income $ 12,867 $ 11,951 $ 7,356
Additional minimum pension liability adjustments per above — — 10
Other comprehensive income (loss) per above (16,677) 4,934 41
Total Comprehensive Income (Loss) $ (3,810) $ 16,885 $ 7,407
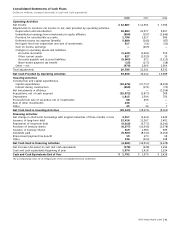
The accompanying notes are an integral part of the consolidated financial statements.