AT&T Wireless 2008 Annual Report Download - page 34
Download and view the complete annual report
Please find page 34 of the 2008 AT&T Wireless annual report below. You can navigate through the pages in the report by either clicking on the pages listed below, or by using the keyword search tool below to find specific information within the annual report.-
 1
1 -
2
-
3
-
4
-
5
-
6
-
7
-
8
-
9
-
10
-
11
-
12
-
13
-
14
-
15
-
16
-
17
-
18
-
19
-
20
-
21
-
22
-
23
-
 24
24 -
 25
25 -
 26
26 -
 27
27 -
 28
28 -
 29
29 -
 30
30 -
 31
31 -
 32
32 -
 33
33 -
 34
34 -
 35
35 -
 36
36 -
 37
37 -
 38
38 -
 39
39 -
 40
40 -
 41
41 -
 42
42 -
 43
43 -
 44
44 -
45
-
46
-
47
-
48
-
49
-
50
-
51
-
52
-
53
-
54
-
55
-
56
-
57
-
58
-
59
-
60
-
61
-
62
-
63
-
64
-
65
-
66
-
67
-
68
-
69
-
70
-
71
-
72
-
73
-
74
-
75
-
76
-
77
-
78
-
79
-
80
-
81
-
82
-
83
-
84
 |
 |

Management’s Discussion and Analysis of Financial Condition and Results of Operations (continued)
Dollars in millions except per share amounts
32
| AT&T Annual Report 2008
Advertising & Publishing
Segment Results
Percent Change
2008 vs. 2007 vs.
2008 2007 2006 2007 2006
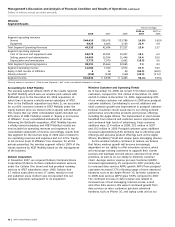
Total Segment Operating Revenues $5,502 $5,851 $3,685 (6.0)% 58.8%
Segment operating expenses
Cost of sales 1,716 1,645 1,121 4.3 46.7
Selling, general and administrative 1,282 1,421 616 (9.8) —
Depreciation and amortization 789 924 3 (14.6) —
Total Segment Operating Expenses 3,787 3,990 1,740 (5.1) —
Segment Operating Income 1,715 1,861 1,945 (7.8) (4.3)
Equity in Net Income (Loss) of Affiliates — — (17) — —
Segment Income $1,715 $1,861 $1,928 (7.8)% (3.5)%
Operating revenues decreased $349, or 6.0%, in 2008
largely driven by continuing declines in print revenue of $453
and lower sales agency revenue of approximately $113 due
to the sale of the independent line of business segment of
the L.M. Berry Company. This decrease was partially offset
by increased Internet advertising revenue of $196. In 2007,
operating revenues increased $2,166, or 58.8%, primarily
due to the addition of BellSouth’s operating results, which
increased operating revenues approximately $2,220 in 2007.
This increase was largely driven by print advertising revenue
of $1,859 and Internet advertising revenue of $200.
Operating expenses decreased $203, or 5.1%, in 2008
largely driven by decreased depreciation and amortization of
$135 resulting from use of an accelerated method of amorti-
zation for the customer list acquired as part of the BellSouth
acquisition, and lower employee, professional and contract
related expenses. These expense decreases were partially
offset by increased YELLOWPAGES.COM expansion costs. In
2007, operating expenses increased $2,250 primarily due to
the addition of BellSouth’s operating results, which increased
total operating expenses by approximately $2,110 in 2007.
Accounting Impacts From the BellSouth Acquisition
FAS 141 requires that BellSouth deferred revenue and
expenses from directories published during the 12-month
period ending with the December 29, 2006 acquisition date
not be included in our consolidated results. However, for
management reporting purposes we continued to amortize
these balances over the life of the directory (typically
12months). Thus, for segment disclosure purposes, our
advertising & publishing segment results included revenue
of $964 and expenses of $308 in 2007. See Note 4 for
a discussion of FAS 141.
Operating Results
Our advertising & publishing segment operating income
margin was 31.2% in 2008, 31.8% in 2007 and 52.8% in 2006.
The decrease in the segment operating income margin in 2008
was primarily the result of decreased operating revenues.
The decrease in the segment operating income margin in
2007 was primarily due to the addition of BellSouth’s
operating results, including the amortization of BellSouth’s
customer lists acquired as a part of the acquisition.
Other
Segment Results
Percent Change
2008 vs. 2007 vs.
2008 2007 2006 2007 2006
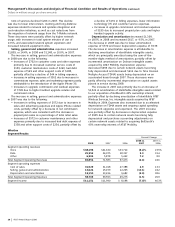
Total Segment Operating Revenues $2,043 $2,229 $1,883 (8.3)% 18.4%
Total Segment Operating Expenses 2,929 2,040 1,764 43.6 15.6
Segment Operating Income (Loss) (886) 189 119 — 58.8
Equity in Net Income of Affiliates 813 676 2,020 20.3 (66.5)
Segment Income (Loss) $ (73) $ 865 $2,139 — (59.6)%
Our other segment operating results consist primarily of
Sterling, customer information services (primarily operator
services and payphone), corporate and other operations.
Sterling provides business-integration software and services.
Operating revenues decreased $186, or 8.3%, in 2008 and
increased $346, or 18.4%, in 2007. The decrease in 2008 is
primarily due to reduced revenues from our operator services
and our retail payphone operations. We are in the process of
ending our retail payphone operations. The increase in 2007
is primarily due to the addition of BellSouth’s other operations
and increased operating revenue at Sterling partially offset
by decreased revenues from our retail payphone operations.
Operating expenses increased $889, or 43.6%, in 2008
and $276, or 15.6%, in 2007. The increase in 2008 was
primarily due to charges of $978 associated with our
workforce reductions announced in 2008, primarily
employees in non-customer-facing areas of the business
as a result of the restructure of our operations from a
collection of regional companies to a single national
approach. This was partially offset by reduction in reserves