AT&T Wireless 2008 Annual Report Download - page 28
Download and view the complete annual report
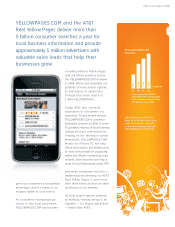
Please find page 28 of the 2008 AT&T Wireless annual report below. You can navigate through the pages in the report by either clicking on the pages listed below, or by using the keyword search tool below to find specific information within the annual report.-
 1
1 -
2
-
3
-
4
-
5
-
6
-
7
-
8
-
9
-
10
-
11
-
12
-
13
-
14
-
15
-
16
-
17
-
 18
18 -
 19
19 -
 20
20 -
 21
21 -
 22
22 -
 23
23 -
 24
24 -
 25
25 -
 26
26 -
 27
27 -
 28
28 -
 29
29 -
 30
30 -
 31
31 -
 32
32 -
 33
33 -
 34
34 -
 35
35 -
 36
36 -
 37
37 -
 38
38 -
39
-
40
-
41
-
42
-
43
-
44
-
45
-
46
-
47
-
48
-
49
-
50
-
51
-
52
-
53
-
54
-
55
-
56
-
57
-
58
-
59
-
60
-
61
-
62
-
63
-
64
-
65
-
66
-
67
-
68
-
69
-
70
-
71
-
72
-
73
-
74
-
75
-
76
-
77
-
78
-
79
-
80
-
81
-
82
-
83
-
84
 |
 |

26
| AT&T Annual Report 2008
Accounting for AT&T Mobility
The wireless segment reflects 100% of the results reported
by AT&T Mobility, which was our wireless joint venture with
BellSouth prior to the December 29, 2006 acquisition, at
which time it became a wholly-owned subsidiary of AT&T.
Prior to the BellSouth acquisition (see Note 2), we accounted
for our 60% economic interest in AT&T Mobility under the
equity method since we shared control equally with BellSouth.
This means that our 2006 consolidated results included our
60% share of AT&T Mobility’s results in “Equity in net income
of affiliates” in our consolidated statements of income.
Following the BellSouth acquisition, AT&T Mobility became
a wholly-owned subsidiary and AT&T Mobility’s results are
now included as operating revenues and expenses in our
consolidated statements of income. Accordingly, results from
this segment for the last two days of 2006 were included in
our operating revenues and expenses and not in the “Equity
in net income (loss) of affiliates” line. However, for all the
periods presented, the wireless segment reflects 100% of the
results reported by AT&T Mobility based on the management
of the business.
Dobson Acquisition
In November 2007, we acquired Dobson Communications
Corporation (Dobson). Dobson marketed wireless services
under the Cellular One brand and had provided roaming
services to AT&T subsidiaries since 1990. Dobson had
1.7million subscribers across 17 states, mostly in rural
and suburban areas. Dobson was incorporated into our
wireless operations subsequent to its acquisition.
Wireless Customer and Operating Trends
As of December 31, 2008, we served 77.0 million wireless
customers, compared to 70.1 million at December 31, 2007,
and 61.0 million at December 31, 2006. Approximately 69%
of our wireless customer net additions in 2008 were postpaid
customer additions. Contributing to our net additions and
retail customer growth was improvement in postpaid customer
turnover (customer churn) levels due to our strong network
performance and attractive products and services offerings,
including the Apple iPhone. The improvement in churn levels
benefited from network and customer service improvements
and continued high levels of advertising. Gross customer
additions were 21.4 million in 2008, 20.1 million in 2007
and 19.2 million in 2006. Postpaid customer gross additions
increased approximately 8.4% primarily due to attractive plan
offerings and exclusive product offerings such as the Apple
iPhone, BlackBerry® Bold and unique quick messaging devices.
As the wireless industry continues to mature, we believe
that future wireless growth will become increasingly
dependent on our ability to offer innovative services, which
will encourage existing customers to upgrade their current
services and handsets and will attract customers from other
providers, as well as on our ability to minimize customer
churn. Average service revenue per user/customer (ARPU)
increased approximately 1% compared to 2007 primarily due
to increased data services ARPU growth. ARPU from postpaid
customers increased 3.7% reflecting usage of more advanced
handsets, such as the Apple iPhone 3G, by these customers.
In 2008, data services ARPU grew 33.8% compared to 2007.
The continued increase in data revenue was related to
increased use of text messaging, Internet access, e-mail
and other data services. We expect continued growth from
data services as more customers purchase advanced
handsets, such as iPhone 3G, and laptop cards and as our
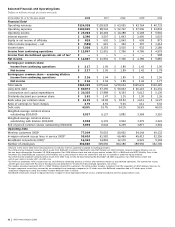
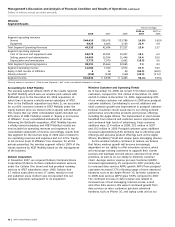
Wireless
Segment Results
Percent Change
2008 vs. 2007 vs.
2008 2007 2006 2007 2006
Segment operating revenues
Service $44,410 $38,678 $33,788 14.8% 14.5%
Equipment 4,925 4,006 3,749 22.9 6.9
Total Segment Operating Revenues 49,335 42,684 37,537 15.6 13.7
Segment operating expenses
Cost of services and equipment sales 18,078 15,991 15,057 13.1 6.2
Selling, general and administrative 14,403 12,594 11,446 14.4 10.0
Depreciation and amortization 5,770 7,079 6,462 (18.5) 9.5
Total Segment Operating Expenses 38,251 35,664 32,965 7.3 8.2
Segment Operating Income 11,084 7,020 4,572 57.9 53.5
Equity in Net Income of Affiliates 6 16 40 (62.5) (60.0)
Minority Interest1 (256) (198) (169) (29.3) (17.2)
Segment Income $10,834 $ 6,838 $ 4,443 58.4% 53.9%
1Minority interest is recorded as “Other Income (Expense) – Net” in the consolidated statements of income.
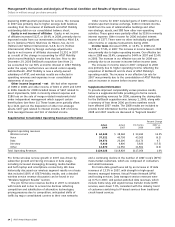
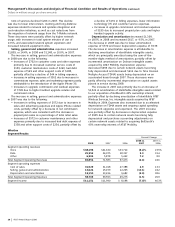
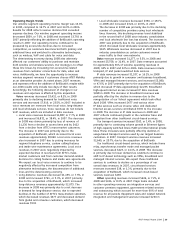
Management’s Discussion and Analysis of Financial Condition and Results of Operations (continued)
Dollars in millions except per share amounts