AT&T Wireless 2008 Annual Report Download - page 75
Download and view the complete annual report
Please find page 75 of the 2008 AT&T Wireless annual report below. You can navigate through the pages in the report by either clicking on the pages listed below, or by using the keyword search tool below to find specific information within the annual report.-
 1
1 -
2
-
3
-
4
-
5
-
6
-
7
-
8
-
9
-
10
-
11
-
12
-
13
-
14
-
15
-
16
-
17
-
18
-
19
-
20
-
21
-
22
-
23
-
24
-
25
-
26
-
27
-
28
-
29
-
30
-
31
-
32
-
33
-
34
-
35
-
36
-
37
-
38
-
39
-
40
-
41
-
42
-
43
-
44
-
45
-
46
-
47
-
48
-
49
-
50
-
51
-
52
-
53
-
54
-
55
-
56
-
57
-
58
-
59
-
60
-
61
-
62
-
63
-
64
-
 65
65 -
 66
66 -
 67
67 -
 68
68 -
 69
69 -
 70
70 -
 71
71 -
 72
72 -
 73
73 -
 74
74 -
 75
75 -
 76
76 -
 77
77 -
 78
78 -
 79
79 -
 80
80 -
 81
81 -
 82
82 -
 83
83 -
 84
84
 |
 |

AT&T Annual Report 2008
| 73
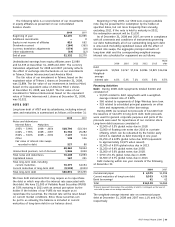
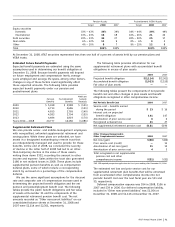
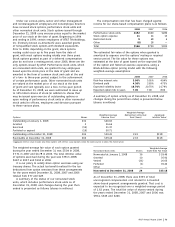
The compensation cost that has been charged against
income for our share-based compensation plans is as follows:
2008 2007 2006
Performance stock units $152 $620 $282
Stock option expense 11 14 13
Restricted stock 9 68 6
Other (6) 18 —
Total $166 $720 $301
The estimated fair value of the options when granted is
amortized to expense over the options’ vesting or required
service period. The fair value for these options was
estimated at the date of grant based on the expected life
of the option and historical exercise experience, using a
Black-Scholes option pricing model with the following
weighted-average assumptions:
2008 2007 2006
Risk-free interest rate 3.96% 5.01% 4.94%
Dividend yield 4.36% 3.65% 4.75%
Expected volatility factor 18.76% 20.75% 21.79%
Expected option life in years 7.00 7.00 8.00
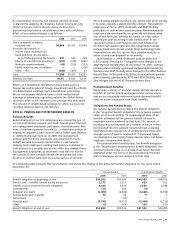
A summary of option activity as of December 31, 2008, and
changes during the period then ended, is presented below
(shares in millions):
Under our various plans, senior and other management
and nonmanagement employees and nonemployee directors
have received stock options, performance stock units and
other nonvested stock units. Stock options issued through
December 31, 2008 carry exercise prices equal to the market
price of our stock at the date of grant. Beginning in 1994
and ending in 1999, certain employees of AT&T Teleholdings,
Inc. (formerly known as Ameritech) were awarded grants
of nonqualified stock options with dividend equivalents.
Prior to 2006, depending on the grant, stock options
vesting could occur up to five years from the date of
grant, with most options vesting ratably over three years.
Stock options granted as part of a deferred compensation
plan do not have a vesting period; since 2006, these are the
only options issued by AT&T. Performance stock units, which
are nonvested stock units, are granted to key employees
based upon the stock price at the date of grant and are
awarded in the form of common stock and cash at the end
of a two- to three-year period, subject to the achievement
of certain performance goals. Other nonvested stock units
are valued at the market price of our stock at the date
of grant and vest typically over a two- to five-year period.
As of December 31, 2008, we were authorized to issue up
to 125 million shares of stock (in addition to shares that
may be issued upon exercise of outstanding options or
upon vesting of performance stock units or other nonvested
stock units) to officers, employees and directors pursuant
to these various plans.
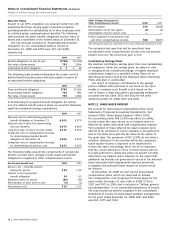
Weighted-Average
Weighted-Average Remaining Contractual Aggregate
Options Shares Exercise Price Term (Years) Intrinsic Value1
Outstanding at January 1, 2008 231 $40.03
Granted 2 36.66
Exercised (10) 31.37
Forfeited or expired (19) 50.71
Outstanding at December 31, 2008 204 $39.41 2.41 $118
Exercisable at December 31, 2008 202 $39.44 2.33 $118
1Aggregate intrinsic value includes only those options with intrinsic value (options where the exercise price is below the market price).
Weighted-Average
Nonvested Stock Units Shares Grant-Date Fair Value
Nonvested at January 1, 2008 36 $ 29.49
Granted 10 35.92
Vested (21) 26.03
Forfeited (1) 35.20
Other — —
Nonvested at December 31, 2008 24 $35.18
As of December 31, 2008, there was $335 of total
unrecognized compensation cost related to nonvested
share-based payment arrangements granted. That cost is
expected to be recognized over a weighted-average period
of 1.62 years. The total fair value of shares vested during
the years ended December 31, 2008, 2007 and 2006 was
$554, $345 and $246.
The weighted-average fair value of each option granted
during the year ended December 31 was $5.04 in 2008,
$7.71 in 2007 and $4.78 in 2006. The total intrinsic value
of options exercised during the year was $78 in 2008,
$667 in 2007 and $134 in 2006.
It is our policy to satisfy share option exercises using our
treasury shares. The actual tax benefit realized for the tax
deductions from option exercises from these arrangements
for the years ended December 31, 2008, 2007 and 2006
totaled $10, $77 and $28.
A summary of the status of our nonvested stock
units, which includes performance stock units as of
December 31, 2008, and changes during the year then
ended is presented as follows (shares in millions):