AT&T Wireless 2008 Annual Report Download - page 26
Download and view the complete annual report
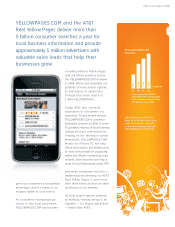
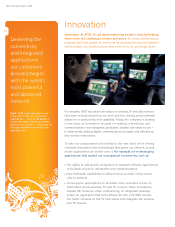
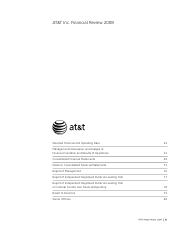
Please find page 26 of the 2008 AT&T Wireless annual report below. You can navigate through the pages in the report by either clicking on the pages listed below, or by using the keyword search tool below to find specific information within the annual report.-
 1
1 -
2
-
3
-
4
-
5
-
6
-
7
-
8
-
9
-
10
-
11
-
12
-
13
-
14
-
15
-
 16
16 -
 17
17 -
 18
18 -
 19
19 -
 20
20 -
 21
21 -
 22
22 -
 23
23 -
 24
24 -
 25
25 -
 26
26 -
 27
27 -
 28
28 -
 29
29 -
 30
30 -
 31
31 -
 32
32 -
 33
33 -
 34
34 -
 35
35 -
 36
36 -
37
-
38
-
39
-
40
-
41
-
42
-
43
-
44
-
45
-
46
-
47
-
48
-
49
-
50
-
51
-
52
-
53
-
54
-
55
-
56
-
57
-
58
-
59
-
60
-
61
-
62
-
63
-
64
-
65
-
66
-
67
-
68
-
69
-
70
-
71
-
72
-
73
-
74
-
75
-
76
-
77
-
78
-
79
-
80
-
81
-
82
-
83
-
84
 |
 |

24
| AT&T Annual Report 2008
preparing 2008 spectrum purchases for service. The increase
in 2007 was primarily due to higher average debt balances
resulting from the inclusion of BellSouth and AT&T Mobility
outstanding debt on our consolidated balance sheet.
Equity in net income of affiliates Equity in net income
of affiliates increased $127, or 18.4%, in 2008, primarily due to
improved results from our investments in América Móvil S.A.
de C.V. (América Móvil), Télefonos de México, S.A. de C.V.
(Telmex) and Telmex Internacional, S.A.B. de C.V. (Telmex
Internacional) offset by foreign exchange adjustments.
Equity in net income of affiliates decreased $1,351 in 2007
as a result of the change in accounting for AT&T Mobility
which moved Mobility’s results from this line. Prior to the
December 29, 2006 BellSouth acquisition (see Note 2),
we accounted for our 60% economic interest in AT&T Mobility
under the equity method since we shared control equally
with BellSouth. AT&T Mobility is now a wholly-owned
subsidiary of AT&T, and wireless results are reflected in
operating revenues and expenses in our consolidated
statements of income.
Other income (expense) – net We had other expense
of $589 in 2008, and other income of $615 in 2007 and $393
in 2006. Results for 2008 included losses of $467 related to
asset impairments, $261 in minority interest expense and
$180 loss on the sale of merger-related investments held
under independent management which support certain
benefit plans (see Note 11). These losses were partially offset
by a $121 gain on the disposition of other non-strategic
assets, $107 gain related to interest income, $49 of income
from leveraged leases and $41 of dividend income.
Other income for 2007 included gains of $409 related to a
wireless spectrum license exchange, $166 in interest income,
$148 from the sale of administrative buildings and other
non-strategic assets, and $88 from other non-operating
activities. These gains were partially offset by $196 in minority
interest expense. Other income for 2006 included interest
income of $377. There were no other individually significant
other income or expense transactions during 2006.
Income taxes increased $783, or 12.5%, in 2008 and
$2,728, or 77.4%, in 2007. The increase in income taxes in 2008
was primarily due to higher operating income. Our effective tax
rate in 2008 was 35.4%, compared to 34.4% in 2007 and 32.4%
in 2006. The increase in our effective tax rate for 2008 was
primarily due to an increase in income before income taxes.
The increase in income taxes in 2007 compared to 2006
was primarily due to higher operating income reflecting the
acquisition of BellSouth and its share of AT&T Mobility’s
operating results. The increase in our effective tax rate for
2007 was primarily due to the consolidation of AT&T Mobility
and an increase in income before income taxes.
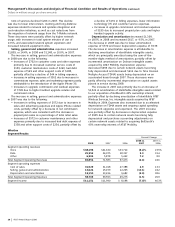
Supplemental Information
To provide improved comparability versus previous results,
below is a supplemental table providing pro forma consoli-
dated operating revenues for 2006, assuming the closing date
for the BellSouth acquisition was January 1, 2006, along with
a summary of how these 2006 pro forma numbers would
have affected 2007 results. The 2008 results are included to
provide trend information but the comparisons between
2008 and 2007 results are discussed in “Segment Results.”
Management’s Discussion and Analysis of Financial Condition and Results of Operations (continued)
Dollars in millions except per share amounts
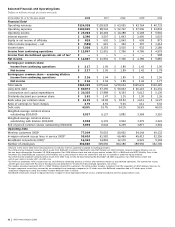
Supplemental Consolidated Operating Revenues Information
Percent Change
Actual Actual Pro Forma 2007 vs.
2008 2007 2006 2006
Segment operating revenues
Wireless service $ 44,249 $ 38,568 $ 33,692 14.5%
Voice 37,321 40,798 43,505 (6.2)
Data 24,372 23,206 22,173 4.7
Directory 5,416 4,806 5,823 (17.5)
Other 12,670 11,550 11,861 (2.6)
Total Operating Revenues $124,028 $118,928 $117,054 1.6%
Pro forma wireless service growth in 2007 was driven by
subscriber growth and strong increases in data usage,
including increased messaging, browsing, media bundles
and both laptop and smartphone connectivity. We have
historically discussed our wireless segment results on a basis
that included 100% of AT&T Mobility results, and a detailed
wireless service revenue discussion can be found in our
“Wireless Segment Results” section.
The pro forma voice revenue decline in 2007 is consistent
with trends and is due to access line declines reflecting
competition and substitution of alternative technologies,
pricing pressures due to competition, anticipated shifts of
traffic by major consolidated carriers to their own networks
and a continuing decline in the number of AT&T Corp.’s (ATTC)
mass-market customers, which are composed of consumers
and small businesses.
Pro forma data growth was led by an increase in IP data
revenues of 13.3% in 2007, with strength in high-speed
Internet, managed Internet, Virtual Private Network (VPN)
and hosting services. Data transport service revenues were
up 0.7% in 2007, and packet-switched data revenues, which
include frame relay and asynchronous transfer mode (ATM)
services, were down 7.0%, consistent with the industry trend
of customers switching to IP-based services from traditional
circuit-based services.