AT&T Wireless 2008 Annual Report Download - page 27
Download and view the complete annual report
Please find page 27 of the 2008 AT&T Wireless annual report below. You can navigate through the pages in the report by either clicking on the pages listed below, or by using the keyword search tool below to find specific information within the annual report.-
 1
1 -
2
-
3
-
4
-
5
-
6
-
7
-
8
-
9
-
10
-
11
-
12
-
13
-
14
-
15
-
16
-
 17
17 -
 18
18 -
 19
19 -
 20
20 -
 21
21 -
 22
22 -
 23
23 -
 24
24 -
 25
25 -
 26
26 -
 27
27 -
 28
28 -
 29
29 -
 30
30 -
 31
31 -
 32
32 -
 33
33 -
 34
34 -
 35
35 -
 36
36 -
 37
37 -
38
-
39
-
40
-
41
-
42
-
43
-
44
-
45
-
46
-
47
-
48
-
49
-
50
-
51
-
52
-
53
-
54
-
55
-
56
-
57
-
58
-
59
-
60
-
61
-
62
-
63
-
64
-
65
-
66
-
67
-
68
-
69
-
70
-
71
-
72
-
73
-
74
-
75
-
76
-
77
-
78
-
79
-
80
-
81
-
82
-
83
-
84
 |
 |

AT&T Annual Report 2008
| 25
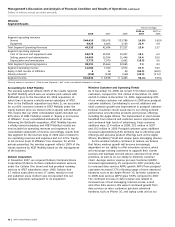
Directory results were lower in 2007 due to the purchase
accounting treatment of directories delivered by BellSouth’s
advertising and publishing businesses in the 12 months prior
to the merger (see Note 4). In accordance with GAAP, the
deferred revenues from these books were not included in the
2007 consolidated directory revenues. Had those deferred
revenues been included in 2007, directory revenues would
have increased by $964. The pro forma revenues for 2006
do not reflect this purchase accounting treatment of deferred
directory revenues.
Pro forma other revenues decreased in 2007 due to our
decision to de-emphasize sales of lower-margin, stand-alone
customer premises equipment.
Segment Results
Our segments are strategic business units that offer
different products and services and are managed accordingly.
As a result of our acquisitions of BellSouth and ATTC, we
revised our segment reporting to represent how we now
manage our business, restating prior periods to conform
to the current segments. Our operating segment results
presented in Note4 and discussed below for each segment
follow our internal management reporting. We analyze our
various operating segments based on segment income
before income taxes. Each segment’s percentage of total
segment operating revenue and income calculations is
derived from our segment results table in Note 4 and
reflects amounts before eliminations. We have four
reportable segments: (1)wireless, (2)wireline,
(3)advertising & publishing and (4)other.
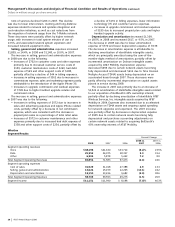
The wireless segment accounted for approximately 39%
of our 2008 total segment operating revenues as compared
to 35% in 2007 and 46% of our 2008 total segment income
as compared to 32% in 2007. This segment offers wireless
voice and data communications services across the
UnitedStates. This segment reflects 100% of the results
reported by AT&T Mobility, which was our wireless joint
venture with BellSouth prior to the December 29, 2006
acquisition and is now a wholly-owned subsidiary of AT&T.
Prior to the acquisition, although we analyzed AT&T Mobility’s
revenues and expenses under the wireless segment, we
eliminated the wireless segment in our consolidated financial
statements. In our 2006 and prior consolidated financial
statements we reported our 60% proportionate share of
AT&T Mobility’s results as equity in net income of affiliates.
The wireline segment accounted for approximately
55% of our 2008 total segment operating revenues as
compared to 59% in 2007 and 47% of our 2008 total
segment income as compared to 55% in 2007. This segment
provides both retail and wholesale landline communications
services, including local and long-distance voice, switched
access, IP and Internet access data, messaging services,
managed networking to business customers, AT&T U-verseSM
TV service and satellite television services through our
agency agreements.
The advertising & publishing segment accounted for
approximately 4% of our 2008 total segment operating
revenues as compared to 5% in 2007 and 7% of our
2008 total segment income as compared to 9% in 2007.
This segment includes our directory operations, which
publish Yellow and White Pages directories and sell
directory advertising, Internet-based advertising and
local search. For 2007, this segment includes 100%
of the results of YELLOWPAGES.COM (YPC), which
was a joint venture with BellSouth prior to the
December 29, 2006 acquisition and is now a wholly-
owned subsidiary of AT&T.
Under Statement of Financial Accounting Standards
No.141, “Business Combinations” (FAS 141), deferred revenue
and expenses from BellSouth directories published during
the 12-month period ending with the December 29, 2006
acquisition date were not recognized in 2007 consolidated
results. Accordingly, our consolidated revenue and expenses
in 2007 related to directory operations were lower. Because
management assesses the performance of the segment
including the revenue and expenses associated with those
directories, for segment reporting purposes, our 2007
advertising & publishing segment results include revenues of
$964 and expenses of $308, related to directories published
prior to our acquisition of BellSouth. These amounts are
eliminated in our consolidated results (see Note 4).
The other segment accounted for approximately 2%
of our 2008 total segment operating revenues as compared
to 1% in 2007 and less than 1% of our 2008 total segment
income as compared to 4% in 2007. This segment includes
results from Sterling Commerce, Inc. (Sterling), customer
information services, payphone, and all corporate and other
operations. During 2008, we announced our intention to
discontinue our retail payphone operations. Additionally,
this segment includes our portion of the results from our
international equity investments and charges of $978
associated with our workforce reductions announced in
2008. Prior to December 29, 2006, this segment also
included our results from AT&T Mobility as equity in net
income of affiliates, as discussed above.
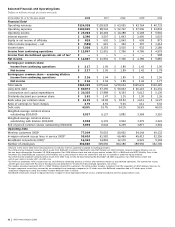
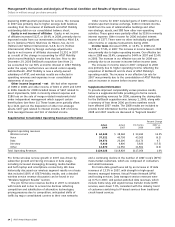
The following tables show components of results of
operations by segment. We discuss significant segment
results following each table. We discuss capital expenditures
for each segment in “Liquidity and Capital Resources.”