TCF Bank 2014 Annual Report Download - page 97
Download and view the complete annual report
Please find page 97 of the 2014 TCF Bank annual report below. You can navigate through the pages in the report by either clicking on the pages listed below, or by using the keyword search tool below to find specific information within the annual report.-
 1
1 -
2
-
3
-
4
-
5
-
6
-
7
-
8
-
9
-
10
-
11
-
12
-
13
-
14
-
15
-
16
-
17
-
18
-
19
-
20
-
21
-
22
-
23
-
24
-
25
-
26
-
27
-
28
-
29
-
30
-
31
-
32
-
33
-
34
-
35
-
36
-
37
-
38
-
39
-
40
-
41
-
42
-
43
-
44
-
45
-
46
-
47
-
48
-
49
-
50
-
51
-
52
-
53
-
54
-
55
-
56
-
57
-
58
-
59
-
60
-
61
-
62
-
63
-
64
-
65
-
66
-
67
-
68
-
69
-
70
-
71
-
72
-
73
-
74
-
75
-
76
-
77
-
78
-
79
-
80
-
81
-
82
-
83
-
84
-
85
-
86
-
 87
87 -
 88
88 -
 89
89 -
 90
90 -
 91
91 -
 92
92 -
 93
93 -
 94
94 -
 95
95 -
 96
96 -
 97
97 -
 98
98 -
 99
99 -
 100
100 -
 101
101 -
 102
102 -
 103
103 -
 104
104 -
 105
105 -
 106
106 -
 107
107 -
108
-
109
-
110
-
111
-
112
-
113
-
114
-
115
-
116
-
117
-
118
-
119
-
120
-
121
-
122
-
123
-
124
-
125
-
126
-
127
-
128
-
129
-
130
-
131
-
132
-
133
-
134
-
135
 |
 |

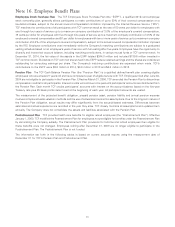
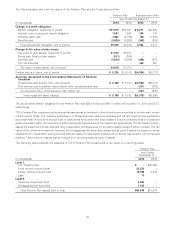
The actuarial assumptions used in the Pension Plan valuation are reviewed annually. The expected long-term rate of return on
plan assets is determined by reference to historical market returns and future expectations. The 10-year average return of the
index consistent with the Pension Plan’s current investment strategy was 3.2%, net of administrative expenses. A 1.0%
difference in the expected return on plan assets would result in a $0.4 million change in net periodic pension expense.
The discount rate used to determine TCF’s pension and postretirement benefit obligations as of December 31, 2014 and 2013
was determined by matching estimated benefit cash flows to a yield curve derived from corporate bonds rated AA by either
Moody’s or Standard and Poor’s. Bonds containing call or put provisions were excluded. The average estimated duration of TCF’s
Pension Plan and Postretirement Plan varied between seven and eight years.
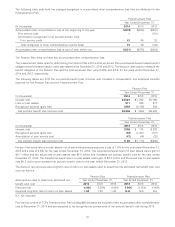
Included within the net periodic benefit cost for the Pension Plan are recognized actuarial gains and losses. The decrease in the
discount rate from 4.0% at December 31, 2013 to 3.25% at December 31, 2014 increased net periodic benefit cost by
$1.9 million during 2014. Updated mortality tables at December 31, 2014 and various plan participant census changes decreased
the 2014 net periodic benefit cost by $32 thousand.
Included within the net periodic benefit cost for the Postretirement Plan are recognized actuarial gains and losses. The
Postretirement Plan change in actuarially estimated cost per participant as of December 31, 2014 reduced net periodic benefit
cost by $0.6 million. The decrease in the discount rate from 4.0% at December 31, 2013 to 3.25% at December 31, 2014
increased the net periodic benefit cost by $0.3 million. Updated mortality tables at December 31, 2014 and various plan
demographic changes increased the net periodic benefit obligation by $0.3 million.
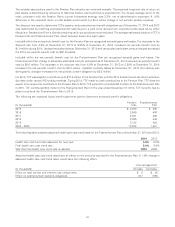
For 2014, TCF was eligible to contribute up to $10.9 million to the Pension Plan until the 2014 federal income tax return extension
due date under various IRS funding methods. During 2014, TCF made no cash contributions to the Pension Plan. TCF does not
expect to be required to contribute to the Pension Plan in 2015. TCF expects to contribute $0.5 million to the Postretirement Plan
in 2015. TCF contributed $0.4 million to the Postretirement Plan for the year ended December 31, 2014. TCF currently has no
plans to pre-fund the Postretirement Plan in 2015.
The following are expected future benefit payments used to determine projected benefit obligations.
Pension Postretirement
(In thousands) Plan Plan
2015 $ 4,209 $ 505
2016 3,549 486
2017 2,881 466
2018 3,036 445
2019 3,138 424
2020 - 2024 12,284 1,801
The following table presents assumed health care cost trend rates for the Postretirement Plan at December 31, 2014 and 2013.
2014 2013
Health care cost trend rate assumed for next year 5.8% 6.0%
Final health care cost trend rate 5.0% 5.0%
Year that final health care trend rate is reached 2023 2023
Assumed health care cost trend rates have an effect on the amounts reported for the Postretirement Plan. A 1.0% change in
assumed health care cost trend rates would have the following effect.
1-Percentage-Point
(In thousands) Increase Decrease
Effect on total service and interest cost components $ 9 $ (9)
Effect on postretirement benefits obligations 217 (196)
84