TCF Bank 2014 Annual Report Download - page 37
Download and view the complete annual report
Please find page 37 of the 2014 TCF Bank annual report below. You can navigate through the pages in the report by either clicking on the pages listed below, or by using the keyword search tool below to find specific information within the annual report.-
 1
1 -
2
-
3
-
4
-
5
-
6
-
7
-
8
-
9
-
10
-
11
-
12
-
13
-
14
-
15
-
16
-
17
-
18
-
19
-
20
-
21
-
22
-
23
-
24
-
25
-
26
-
 27
27 -
 28
28 -
 29
29 -
 30
30 -
 31
31 -
 32
32 -
 33
33 -
 34
34 -
 35
35 -
 36
36 -
 37
37 -
 38
38 -
 39
39 -
 40
40 -
 41
41 -
 42
42 -
 43
43 -
 44
44 -
 45
45 -
 46
46 -
 47
47 -
48
-
49
-
50
-
51
-
52
-
53
-
54
-
55
-
56
-
57
-
58
-
59
-
60
-
61
-
62
-
63
-
64
-
65
-
66
-
67
-
68
-
69
-
70
-
71
-
72
-
73
-
74
-
75
-
76
-
77
-
78
-
79
-
80
-
81
-
82
-
83
-
84
-
85
-
86
-
87
-
88
-
89
-
90
-
91
-
92
-
93
-
94
-
95
-
96
-
97
-
98
-
99
-
100
-
101
-
102
-
103
-
104
-
105
-
106
-
107
-
108
-
109
-
110
-
111
-
112
-
113
-
114
-
115
-
116
-
117
-
118
-
119
-
120
-
121
-
122
-
123
-
124
-
125
-
126
-
127
-
128
-
129
-
130
-
131
-
132
-
133
-
134
-
135
 |
 |

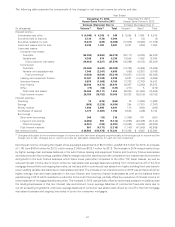
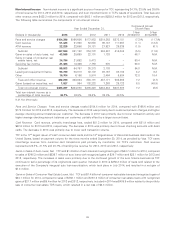
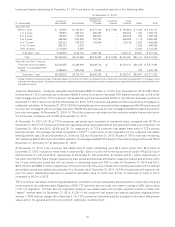
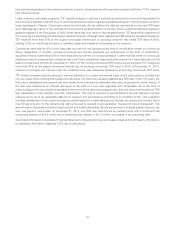
The following table presents the components of the changes in net interest income by volume and rate.
Year Ended
December 31, 2014 December 31, 2013
Versus Same Period in 2013 Versus Same Period in 2012
Increase (Decrease) Due to Increase (Decrease) Due to
(In thousands) Volume(1) Rate(1) Total Volume(1) Rate(1) Total
Interest income:
Investments and other $ (4,046) $ 4,395 $ 349 $ 3,854 $ 1,064 $ 4,918
Securities held to maturity 5,134 (130) 5,004 9 (13) (4)
Securities available for sale (5,431) (649) (6,080) (12,008) (5,068) (17,076)
Loans and leases held for sale 8,388 1,093 9,481 8,227 (269) 7,958
Loans and leases:
Consumer real estate:
Fixed-rate (22,055) (4,863) (26,918) (29,117) (5,225) (34,342)
Variable-rate 4,365 874 5,239 10,545 1,489 12,034
Total consumer real estate (16,452) (5,227) (21,679) (16,296) (6,012) (22,308)
Commercial:
Fixed-rate (15,365) (4,643) (20,008) (10,762) (5,066) (15,828)
Variable- and adjustable-rate 7,045 (2,347) 4,698 (855) (8,251) (9,106)
Total commercial (5,926) (9,384) (15,310) (10,921) (14,013) (24,934)
Leasing and equipment finance 13,047 (8,108) 4,939 5,527 (14,483) (8,956)
Inventory finance 9,839 (1,080) 8,759 17,703 (2,793) 14,910
Auto finance 29,246 (4,572) 24,674 30,367 (4,395) 25,972
Other (79) (50) (129) (277) 5 (272)
Total loans and leases 34,365 (33,111) 1,254 26,280 (41,868) (15,588)
Total interest income 28,790 (18,782) 10,008 20,023 (39,815) (19,792)
Interest expense:
Checking 10 (574) (564) 78 (1,698) (1,620)
Savings (865) (3,229) (4,094) 354 (7,751) (7,397)
Money market 1,946 2,695 4,641 174 (642) (468)
Certificates of deposit 3,779 (1,981) 1,798 5,538 (436) 5,102
Borrowings:
Short-term borrowings 248 (33) 215 (1,368) 477 (891)
Long-term borrowings (6,265) 953 (5,312) (14,988) (22,426) (37,414)
Total borrowings (4,901) (196) (5,097) (19,062) (19,243) (38,305)
Total interest expense 861 (4,177) (3,316) (1,143) (41,545) (42,688)
Net interest income $ 26,802 $(13,478) $ 13,324 $ 18,806 $ 4,090 $ 22,896
(1) Changes attributable to the combined impact of volume and rate have been allocated proportionately to the change due to volume and the
change due to rate. Changes due to volume and rate are calculated independently for each line item presented.
Net interest income, including the impact of tax-equivalent adjustments of $3.3 million, was $818.9 million for 2014, an increase
of 1.7% from $805.6 million for 2013, which was up 2.9% from $782.7 million for 2012. The increase in 2014 was primarily driven
by higher average loan and lease balances in the auto finance, leasing and equipment finance and inventory finance businesses
and reduced cost of borrowings, partially offset by margin reduction resulting from the competitive low interest rate environment
and growth in the auto finance business which has a lower yield when compared to the other TCF asset classes, as well as
reduced interest income due to lower consumer real estate loan average balances resulting from continued run-off of the first
mortgage lien portfolio and ongoing loan sales, as well as a shift in commercial real estate from higher yielding fixed-rate loans to
lower yielding variable rate loans due to marketplace demand. The increase in net interest income in 2013 was primarily driven by
higher average loan and lease balances in the auto finance and inventory finance businesses as well as the balance sheet
repositioning in 2012 which resulted in a reduction to the cost of borrowings, partially offset by a reduction of interest income on
lower balances of mortgage-backed securities. The increase in 2013 was partially offset by downward pressure on yields across
the lending businesses in this low interest rate environment, lower average balances of commercial fixed-rate loans due to
run-off exceeding originations, and lower average balances of consumer real estate loans driven by run-off in the first mortgage
real estate business and ongoing loan sales of junior lien consumer mortgages.
24