TCF Bank 2014 Annual Report Download - page 66
Download and view the complete annual report
Please find page 66 of the 2014 TCF Bank annual report below. You can navigate through the pages in the report by either clicking on the pages listed below, or by using the keyword search tool below to find specific information within the annual report.-
 1
1 -
2
-
3
-
4
-
5
-
6
-
7
-
8
-
9
-
10
-
11
-
12
-
13
-
14
-
15
-
16
-
17
-
18
-
19
-
20
-
21
-
22
-
23
-
24
-
25
-
26
-
27
-
28
-
29
-
30
-
31
-
32
-
33
-
34
-
35
-
36
-
37
-
38
-
39
-
40
-
41
-
42
-
43
-
44
-
45
-
46
-
47
-
48
-
49
-
50
-
51
-
52
-
53
-
54
-
55
-
 56
56 -
 57
57 -
 58
58 -
 59
59 -
 60
60 -
 61
61 -
 62
62 -
 63
63 -
 64
64 -
 65
65 -
 66
66 -
 67
67 -
 68
68 -
 69
69 -
 70
70 -
 71
71 -
 72
72 -
 73
73 -
 74
74 -
 75
75 -
 76
76 -
77
-
78
-
79
-
80
-
81
-
82
-
83
-
84
-
85
-
86
-
87
-
88
-
89
-
90
-
91
-
92
-
93
-
94
-
95
-
96
-
97
-
98
-
99
-
100
-
101
-
102
-
103
-
104
-
105
-
106
-
107
-
108
-
109
-
110
-
111
-
112
-
113
-
114
-
115
-
116
-
117
-
118
-
119
-
120
-
121
-
122
-
123
-
124
-
125
-
126
-
127
-
128
-
129
-
130
-
131
-
132
-
133
-
134
-
135
 |
 |

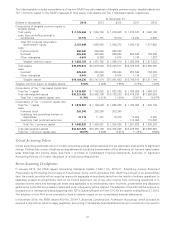
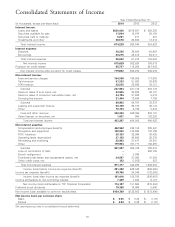
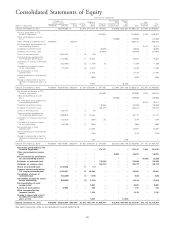
Consolidated Statements of Income
Year Ended December 31,
(In thousands, except per-share data) 2014 2013 2012
Interest income:
Loans and leases $820,436 $819,501 $ 835,380
Securities available for sale 11,994 18,074 35,150
Securities held to maturity 5,281 277 281
Investments and other 36,518 26,688 13,812
Total interest income 874,229 864,540 884,623
Interest expense:
Deposits 38,385 36,604 40,987
Borrowings 20,215 25,312 63,617
Total interest expense 58,600 61,916 104,604
Net interest income 815,629 802,624 780,019
Provision for credit losses 95,737 118,368 247,443
Net interest income after provision for credit losses 719,892 684,256 532,576
Non-interest income:
Fees and service charges 154,386 166,606 177,953
Card revenue 51,323 51,920 52,638
ATM revenue 22,225 22,656 24,181
Subtotal 227,934 241,182 254,772
Gains on sales of auto loans, net 43,565 29,699 22,101
Gains on sales of consumer real estate loans, net 34,794 21,692 5,413
Servicing fee income 21,444 13,406 7,759
Subtotal 99,803 64,797 35,273
Leasing and equipment finance 93,799 90,919 92,172
Other 10,704 6,196 5,974
Fees and other revenue 432,240 403,094 388,191
Gains (losses) on securities, net 1,027 964 102,232
Total non-interest income 433,267 404,058 490,423
Non-interest expense:
Compensation and employee benefits 452,942 429,188 393,841
Occupancy and equipment 139,023 134,694 130,792
FDIC insurance 25,123 32,066 30,425
Operating lease depreciation 27,152 24,500 25,378
Advertising and marketing 22,943 21,477 25,241
Other 179,904 167,777 163,897
Subtotal 847,087 809,702 769,574
Loss on termination of debt –– 550,735
Branch realignment –8,869 –
Foreclosed real estate and repossessed assets, net 24,567 27,950 41,358
Other credit costs, net 123 (1,252) 887
Total non-interest expense 871,777 845,269 1,362,554
Income (loss) before income tax expense (benefit) 281,382 243,045 (339,555)
Income tax expense (benefit) 99,766 84,345 (132,858)
Income (loss) after income tax expense (benefit) 181,616 158,700 (206,697)
Income attributable to non-controlling interest 7,429 7,032 6,187
Net income (loss) attributable to TCF Financial Corporation 174,187 151,668 (212,884)
Preferred stock dividends 19,388 19,065 5,606
Net income (loss) available to common stockholders $154,799 $132,603 $ (218,490)
Net income (loss) per common share:
Basic $ 0.95 $ 0.82 $ (1.37)
Diluted $ 0.94 $ 0.82 $ (1.37)
See accompanying notes to consolidated financial statements.
53