TCF Bank 2014 Annual Report Download - page 103
Download and view the complete annual report
Please find page 103 of the 2014 TCF Bank annual report below. You can navigate through the pages in the report by either clicking on the pages listed below, or by using the keyword search tool below to find specific information within the annual report.-
 1
1 -
2
-
3
-
4
-
5
-
6
-
7
-
8
-
9
-
10
-
11
-
12
-
13
-
14
-
15
-
16
-
17
-
18
-
19
-
20
-
21
-
22
-
23
-
24
-
25
-
26
-
27
-
28
-
29
-
30
-
31
-
32
-
33
-
34
-
35
-
36
-
37
-
38
-
39
-
40
-
41
-
42
-
43
-
44
-
45
-
46
-
47
-
48
-
49
-
50
-
51
-
52
-
53
-
54
-
55
-
56
-
57
-
58
-
59
-
60
-
61
-
62
-
63
-
64
-
65
-
66
-
67
-
68
-
69
-
70
-
71
-
72
-
73
-
74
-
75
-
76
-
77
-
78
-
79
-
80
-
81
-
82
-
83
-
84
-
85
-
86
-
87
-
88
-
89
-
90
-
91
-
92
-
 93
93 -
 94
94 -
 95
95 -
 96
96 -
 97
97 -
 98
98 -
 99
99 -
 100
100 -
 101
101 -
 102
102 -
 103
103 -
 104
104 -
 105
105 -
 106
106 -
 107
107 -
 108
108 -
 109
109 -
 110
110 -
 111
111 -
 112
112 -
 113
113 -
114
-
115
-
116
-
117
-
118
-
119
-
120
-
121
-
122
-
123
-
124
-
125
-
126
-
127
-
128
-
129
-
130
-
131
-
132
-
133
-
134
-
135
 |
 |

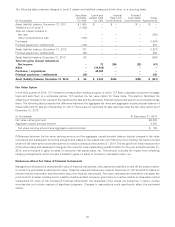
Assets and Liabilities Held in Trust for Deferred Compensation Plans Assets held in trust for deferred compensation plans
include investments in publicly traded stocks, excluding TCF common stock reported in treasury and other equity, and U.S.
Treasury notes. The fair value of these assets, categorized as Level 1, is based upon prices obtained from independent asset
pricing services based on active markets. The fair value of the liabilities equals the fair value of the assets.
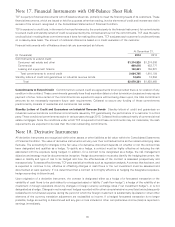
Financial Instruments with Off-Balance Sheet Risk The fair value of TCF’s commitments to extend credit and standby
letters of credit, categorized as Level 2, is estimated using fees currently charged to enter into similar agreements, as
commitments and standby letters of credit similar to TCF’s are not actively traded. Substantially all commitments to extend credit
and standby letters of credit have floating interest rates and do not expose TCF to interest rate risk; therefore fair value is
approximately equal to carrying value.
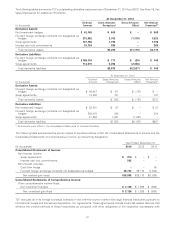
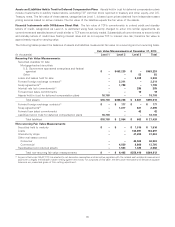
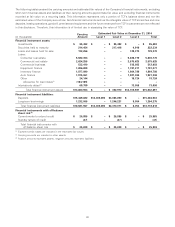
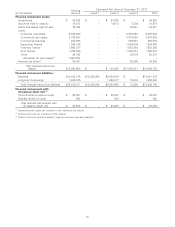
The following tables present the balances of assets and liabilities measured at fair value on a recurring and non-recurring basis.
Fair Value Measurements at December 31, 2014
(In thousands) Level 1 Level 2 Level 3 Total
Recurring Fair Value Measurements:
Securities available for sale:
Mortgage-backed securities:
U.S. Government sponsored enterprises and federal
agencies $ – $463,239 $ – $463,239
Other – – 55 55
Loans and leases held for sale – – 3,308 3,308
Forward foreign exchange contracts(1) – 3,211 – 3,211
Swap agreements(1) – 1,798 – 1,798
Interest rate lock commitments(1) – – 285 285
Forward loan sales commitments – – 19 19
Assets held in trust for deferred compensation plans 18,703 – – 18,703
Total assets $18,703 $468,248 $ 3,667 $490,618
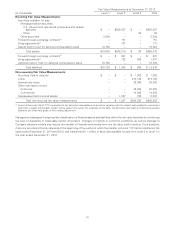
Forward foreign exchange contracts(1) $ – $ 177 $ – $ 177
Swap agreements(1) – 1,877 621 2,498
Forward loan sales commitments – – 42 42
Liabilities held in trust for deferred compensation plans 18,703 – – 18,703
Total liabilities $18,703 $ 2,054 $ 663 $ 21,420
Non-recurring Fair Value Measurements:
Securities held to maturity $ – $ – $ 1,516 $ 1,516
Loans – – 164,897 164,897
Interest-only strips – – 41,204 41,204
Other real estate owned:
Consumer – – 40,502 40,502
Commercial – 4,839 8,866 13,705
Repossessed and returned assets – 1,563 1,425 2,988
Total non-recurring fair value measurements $ – $ 6,402 $258,410 $264,812
(1) As permitted under GAAP, TCF has elected to net derivative receivables and derivative payables with the related cash collateral received and
paid when a legally enforceable master netting agreement exists. For purposes of this table, the derivative receivable and derivative payable
balances are presented gross of this netting adjustment.
90