TCF Bank 2014 Annual Report Download - page 62
Download and view the complete annual report
Please find page 62 of the 2014 TCF Bank annual report below. You can navigate through the pages in the report by either clicking on the pages listed below, or by using the keyword search tool below to find specific information within the annual report.-
 1
1 -
2
-
3
-
4
-
5
-
6
-
7
-
8
-
9
-
10
-
11
-
12
-
13
-
14
-
15
-
16
-
17
-
18
-
19
-
20
-
21
-
22
-
23
-
24
-
25
-
26
-
27
-
28
-
29
-
30
-
31
-
32
-
33
-
34
-
35
-
36
-
37
-
38
-
39
-
40
-
41
-
42
-
43
-
44
-
45
-
46
-
47
-
48
-
49
-
50
-
51
-
 52
52 -
 53
53 -
 54
54 -
 55
55 -
 56
56 -
 57
57 -
 58
58 -
 59
59 -
 60
60 -
 61
61 -
 62
62 -
 63
63 -
 64
64 -
 65
65 -
 66
66 -
 67
67 -
 68
68 -
 69
69 -
 70
70 -
 71
71 -
 72
72 -
73
-
74
-
75
-
76
-
77
-
78
-
79
-
80
-
81
-
82
-
83
-
84
-
85
-
86
-
87
-
88
-
89
-
90
-
91
-
92
-
93
-
94
-
95
-
96
-
97
-
98
-
99
-
100
-
101
-
102
-
103
-
104
-
105
-
106
-
107
-
108
-
109
-
110
-
111
-
112
-
113
-
114
-
115
-
116
-
117
-
118
-
119
-
120
-
121
-
122
-
123
-
124
-
125
-
126
-
127
-
128
-
129
-
130
-
131
-
132
-
133
-
134
-
135
 |
 |

levels of net interest income and facilitate the funding needs of the Company,while maintaining acceptable levels of interest rate
risk and liquidity risk.
ALCO primarily uses two interest rate risk tools with policy limits to evaluate TCF’s interest rate risk: net interest income
simulation and economic value of equity (‘‘EVE’’). In addition, interest rate gap is reviewed to monitor asset and liability repricing
over various time periods.
Net Interest Income Simulation Management utilizes net interest income simulation models to estimate the near-term
effects of changing interest rates on its net interest income. Net interest income simulation involves forecasting net interest
income under a variety of scenarios, including the level of interest rates, the shape of the yield curve and the spreads between
market interest rates. Management exercises its best judgment in making assumptions regarding events that management can
influence, such as non-contractual deposit re-pricings and events outside management’s control, such as customer behavior on
loan and deposit activity and the effect that competition has on both loan and deposit pricing. These assumptions are subjective
and, as a result, net interest income simulation results will differ from actual results due to the timing, magnitude and frequency
of interest rate changes, changes in market conditions, customer behavior and management strategies, among other factors.
TCF performs various sensitivity analyses on assumptions of new loan spreads, prepayment rates, basis risk, deposit attrition
and deposit re-pricing.
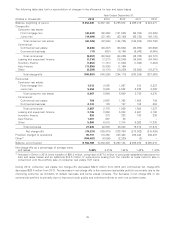
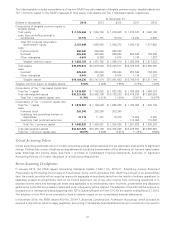
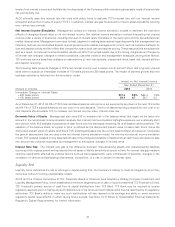
The following table presents changes in TCF’s net interest income over a twelve month period if short- and long-term interest
rates were to sustain an immediate increase of 100 basis points and 200 basis points. The impact of planned growth and new
business activities is factored into the simulation model.
Impact on Net Interest Income
Year Ended December 31,
(Dollars in millions) 2014 2013
Immediate Change in Interest Rates:
+200 basis points $73.6 8.9% $64.4 7.9%
+100 basis points 39.4 4.7 36.7 4.5
As of December 31, 2014, 50.5% of TCF’s loan and lease balances will reprice or are expected to pay down in the next 12 months
and 64.1% of TCF’s deposit balances are low cost or no cost deposits. The mix of assets repricing compared to low cost or no
cost deposits should enable TCF to increase net interest income when interest rates rise.
Economic Value of Equity Management also uses EVE to measure risk in the balance sheet that might not be taken into
account in the net interest income simulation analysis. Net interest income simulation highlights exposure over a relatively short
time period, while EVE analysis incorporates all cash flows over the estimated remaining life of all balance sheet positions. The
valuation of the balance sheet, at a point in time, is defined as the discounted present value of asset cash flows minus the
discounted present value of liability cash flows. EVE analysis addresses only the current balance sheet and does not incorporate
the growth assumptions that are used in the net interest income simulation model. As with the net interest income simulation
model, EVE analysis is based on key assumptions about the timing and variability of balance sheet cash flows and does not take
into account any potential responses by management to anticipated changes in interest rates.
Interest Rate Gap The interest rate gap is the difference between interest-earning assets and interest-bearing liabilities
re-pricing within a given period and represents the net asset or liability sensitivity at a point in time. An interest rate gap measure
could be significantly affected by external factors such as loan prepayments, early withdrawals of deposits, changes in the
correlation of various interest-bearing instruments, competition, or a rise or decline in interest rates.
Liquidity Risk
Liquidity risk is defined as the risk to earnings or capital arising from the Company’s inability to meet its obligations when they
come due without incurring unacceptable losses.
ALCO and the Finance Committee of TCF Financial’s Board of Directors have adopted a Holding Company Investment and
Liquidity Management Policy, which establishes a minimum target amount of cash or liquid investments TCF Financial will hold.
TCF Financial’s primary source of cash flow is capital distributions from TCF Bank. TCF Bank may be required to receive
regulatory approval prior to making any such distributions in the future and such distributions may be restricted by its regulatory
authorities. TCF Bank’s ability to make any such distributions will also depend on its earnings and ability to meet minimum
regulatory capital requirements in effect during future periods. See Note 14 of Notes to Consolidated Financial Statements,
Regulatory Capital Requirements, for further information.
49