TCF Bank 2014 Annual Report Download - page 30
Download and view the complete annual report
Please find page 30 of the 2014 TCF Bank annual report below. You can navigate through the pages in the report by either clicking on the pages listed below, or by using the keyword search tool below to find specific information within the annual report.-
 1
1 -
2
-
3
-
4
-
5
-
6
-
7
-
8
-
9
-
10
-
11
-
12
-
13
-
14
-
15
-
16
-
17
-
18
-
19
-
 20
20 -
 21
21 -
 22
22 -
 23
23 -
 24
24 -
 25
25 -
 26
26 -
 27
27 -
 28
28 -
 29
29 -
 30
30 -
 31
31 -
 32
32 -
 33
33 -
 34
34 -
 35
35 -
 36
36 -
 37
37 -
 38
38 -
 39
39 -
 40
40 -
41
-
42
-
43
-
44
-
45
-
46
-
47
-
48
-
49
-
50
-
51
-
52
-
53
-
54
-
55
-
56
-
57
-
58
-
59
-
60
-
61
-
62
-
63
-
64
-
65
-
66
-
67
-
68
-
69
-
70
-
71
-
72
-
73
-
74
-
75
-
76
-
77
-
78
-
79
-
80
-
81
-
82
-
83
-
84
-
85
-
86
-
87
-
88
-
89
-
90
-
91
-
92
-
93
-
94
-
95
-
96
-
97
-
98
-
99
-
100
-
101
-
102
-
103
-
104
-
105
-
106
-
107
-
108
-
109
-
110
-
111
-
112
-
113
-
114
-
115
-
116
-
117
-
118
-
119
-
120
-
121
-
122
-
123
-
124
-
125
-
126
-
127
-
128
-
129
-
130
-
131
-
132
-
133
-
134
-
135
 |
 |

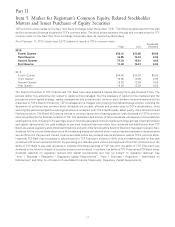
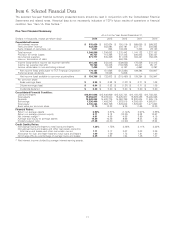
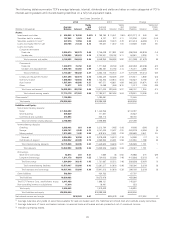
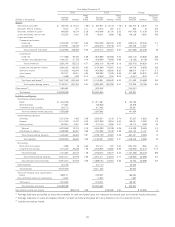
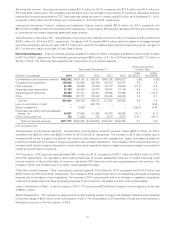
Item 6. Selected Financial Data
The selected five-year financial summary presented below should be read in conjunction with the Consolidated Financial
Statements and related notes. Historical data is not necessarily indicative of TCF’s future results of operations or financial
condition. See ‘‘Item 1A. Risk Factors.’’
Five Year Financial Summary
At or For the Year Ended December 31,
(Dollars in thousands, except per-share data) 2014 2013 2012 2011 2010
Consolidated Income:
Net interest income $ 815,629 $ 802,624 $ 780,019 $ 699,688 $ 699,202
Fees and other revenue 432,240 403,094 388,191 437,171 508,862
Gains (losses) on securities, net 1,027 964 102,232 7,263 29,123
Total revenue 1,248,896 1,206,682 1,270,442 1,144,122 1,237,187
Provision for credit losses 95,737 118,368 247,443 200,843 236,437
Non-interest expense 871,777 845,269 811,819 764,451 756,335
Loss on termination of debt –– 550,735 – –
Income (loss) before income tax expense (benefit) 281,382 243,045 (339,555) 178,828 244,415
Income tax expense (benefit) 99,766 84,345 (132,858) 64,441 90,171
Income attributable to non-controlling interest 7,429 7,032 6,187 4,993 3,297
Net income (loss) attributable to TCF Financial Corporation 174,187 151,668 (212,884) 109,394 150,947
Preferred stock dividends 19,388 19,065 5,606 – –
Net income (loss) available to common stockholders $ 154,799 $ 132,603 $ (218,490) $ 109,394 $ 150,947
Per common share:
Basic earnings (loss) $ 0.95 $ 0.82 $ (1.37) $ 0.71 $ 1.08
Diluted earnings (loss) $ 0.94 $ 0.82 $ (1.37) $ 0.71 $ 1.08
Dividends declared $ 0.20 $ 0.20 $ 0.20 $ 0.20 $ 0.20
Consolidated Financial Condition:
Loans and leases $16,401,646 $15,846,939 $15,425,724 $14,150,255 $14,788,304
Total assets 19,394,611 18,379,840 18,225,917 18,979,388 18,465,025
Deposits 15,449,882 14,432,776 14,050,786 12,202,004 11,585,115
Borrowings 1,236,490 1,488,243 1,933,815 4,388,080 4,985,611
Total equity 2,135,364 1,964,759 1,876,643 1,878,627 1,471,663
Book value per common share 11.10 10.23 9.79 11.65 10.30
Financial Ratios:
Return on average assets 0.96% 0.87% (1.14)% 0.61% 0.85%
Return on average common equity 8.71 8.12 (13.33) 6.32 10.67
Net interest margin(1) 4.61 4.68 4.65 3.99 4.15
Average total equity to average assets 10.89 10.46 9.66 9.24 7.83
Dividend payout ratio 21.28 24.30 (14.60) 28.10 18.52
Credit Quality Ratios:
Non-accrual loans and leases to total loans and leases 1.32% 1.75% 2.46% 2.11% 2.33%
Non-accrual loans and leases and other real estate owned to
total loans and leases and other real estate owned 1.71 2.17 3.07 3.03 3.26
Allowance for loan and lease losses to total loans and leases 1.00 1.59 1.73 1.81 1.80
Net charge-offs as a percentage of average loans and leases 0.49 0.81 1.54 1.45 1.47
(1) Net interest income divided by average interest-earning assets.
17