TCF Bank 2014 Annual Report Download - page 56
Download and view the complete annual report
Please find page 56 of the 2014 TCF Bank annual report below. You can navigate through the pages in the report by either clicking on the pages listed below, or by using the keyword search tool below to find specific information within the annual report.-
 1
1 -
2
-
3
-
4
-
5
-
6
-
7
-
8
-
9
-
10
-
11
-
12
-
13
-
14
-
15
-
16
-
17
-
18
-
19
-
20
-
21
-
22
-
23
-
24
-
25
-
26
-
27
-
28
-
29
-
30
-
31
-
32
-
33
-
34
-
35
-
36
-
37
-
38
-
39
-
40
-
41
-
42
-
43
-
44
-
45
-
 46
46 -
 47
47 -
 48
48 -
 49
49 -
 50
50 -
 51
51 -
 52
52 -
 53
53 -
 54
54 -
 55
55 -
 56
56 -
 57
57 -
 58
58 -
 59
59 -
 60
60 -
 61
61 -
 62
62 -
 63
63 -
 64
64 -
 65
65 -
 66
66 -
67
-
68
-
69
-
70
-
71
-
72
-
73
-
74
-
75
-
76
-
77
-
78
-
79
-
80
-
81
-
82
-
83
-
84
-
85
-
86
-
87
-
88
-
89
-
90
-
91
-
92
-
93
-
94
-
95
-
96
-
97
-
98
-
99
-
100
-
101
-
102
-
103
-
104
-
105
-
106
-
107
-
108
-
109
-
110
-
111
-
112
-
113
-
114
-
115
-
116
-
117
-
118
-
119
-
120
-
121
-
122
-
123
-
124
-
125
-
126
-
127
-
128
-
129
-
130
-
131
-
132
-
133
-
134
-
135
 |
 |
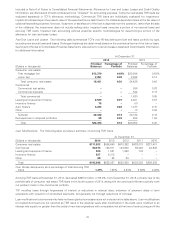
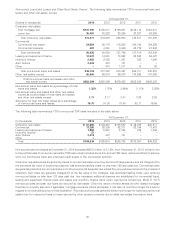
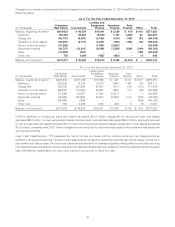
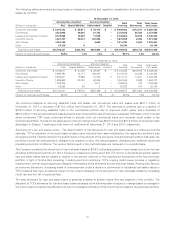
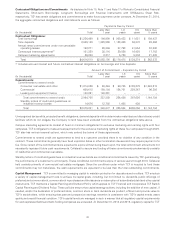
and TCF Bank exceeded their regulatory capital requirements. See Note 14 of Notes to Consolidated Financial Statements,
Regulatory Capital Requirements.
Preferred Stock At December 31, 2014, there were 6,900,000 depositary shares outstanding, each representing a
1/1,000th interest in a share of the Series A Non-Cumulative Perpetual Preferred Stock of TCF Financial Corporation, par value
$.01 per share, with a liquidation preference of $25,000 per share (equivalent to $25 per depositary share)(‘‘Series A Preferred
Stock’’). Dividends are payable on the Series A Preferred Stock if, as and when declared by TCF’s Board of Directors on a
non-cumulative basis on March 1, June 1, September 1 and December 1 of each year at a per annum rate of 7.5%. At
December 31, 2014, there were 4,000,000 shares outstanding of 6.45% Series B Non-Cumulative Perpetual Preferred Stock of
TCF Financial Corporation, par value $.01 per share, with a liquidation preference of $25 per share (‘‘Series B Preferred Stock’’).
Dividends are payable on the Series B Preferred Stock if, as and when declared by TCF’s Board of Directors on a non-cumulative
basis on March 1, June 1, September 1 and December 1 of each year at a per annum rate of 6.45%.
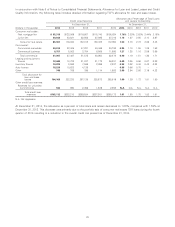
Equity Total equity at December 31, 2014 was $2.1 billion, or 11.0% of total assets, compared with $2.0 billion, or 10.7% of
total assets, at December 31, 2013. Dividends to common stockholders on a per share basis totaled 5 cents for each quarter of
the years ended December 31, 2014 and 2013. TCF’s common dividend payout ratio for the quarters ended December 31, 2014
and 2013 were 41.67% and 22.99%, respectively. TCF Financial’s primary funding sources for dividends are earnings and
dividends received from TCF Bank.
At December 31, 2014, TCF had 5.4 million shares remaining in its stock repurchase program authorized by its Board of
Directors, which has no expiration. Prior consultation with the Federal Reserve is required by regulation before TCF could
repurchase any shares of its common stock.
Tangible common equity at December 31, 2014 was $1.6 billion, or 8.50% of total tangible assets, compared with $1.5 billion, or
8.03% of total tangible assets, at December 31, 2013. Tangible common equity and the Tier 1 common capital ratio are not
financial measures recognized under generally accepted accounting principles in the United States (‘‘GAAP’’) (i.e., non-GAAP).
Tangible common equity represents total equity less preferred stock, goodwill, other intangible assets and non-controlling
interest in subsidiaries. Tangible assets represent total assets less goodwill and other intangible assets. When evaluating capital
adequacy and utilization, management considers financial measures such as tangible common equity to tangible assets and the
Tier 1 common capital ratio. These non-GAAP financial measures are viewed by management as useful indicators of capital levels
available to withstand unexpected market or economic conditions and also provide investors, regulators and other users with
information to be viewed in relation to other banking institutions.
43