TCF Bank 2014 Annual Report Download - page 115
Download and view the complete annual report
Please find page 115 of the 2014 TCF Bank annual report below. You can navigate through the pages in the report by either clicking on the pages listed below, or by using the keyword search tool below to find specific information within the annual report.-
 1
1 -
2
-
3
-
4
-
5
-
6
-
7
-
8
-
9
-
10
-
11
-
12
-
13
-
14
-
15
-
16
-
17
-
18
-
19
-
20
-
21
-
22
-
23
-
24
-
25
-
26
-
27
-
28
-
29
-
30
-
31
-
32
-
33
-
34
-
35
-
36
-
37
-
38
-
39
-
40
-
41
-
42
-
43
-
44
-
45
-
46
-
47
-
48
-
49
-
50
-
51
-
52
-
53
-
54
-
55
-
56
-
57
-
58
-
59
-
60
-
61
-
62
-
63
-
64
-
65
-
66
-
67
-
68
-
69
-
70
-
71
-
72
-
73
-
74
-
75
-
76
-
77
-
78
-
79
-
80
-
81
-
82
-
83
-
84
-
85
-
86
-
87
-
88
-
89
-
90
-
91
-
92
-
93
-
94
-
95
-
96
-
97
-
98
-
99
-
100
-
101
-
102
-
103
-
104
-
 105
105 -
 106
106 -
 107
107 -
 108
108 -
 109
109 -
 110
110 -
 111
111 -
 112
112 -
 113
113 -
 114
114 -
 115
115 -
 116
116 -
 117
117 -
 118
118 -
 119
119 -
 120
120 -
 121
121 -
 122
122 -
 123
123 -
 124
124 -
 125
125 -
126
-
127
-
128
-
129
-
130
-
131
-
132
-
133
-
134
-
135
 |
 |

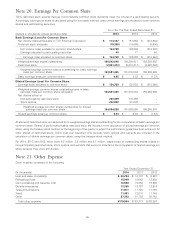
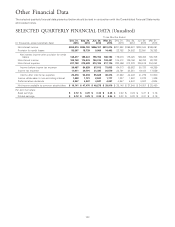
Other Financial Data
The selected quarterly financial data presented below should be read in conjunction with the Consolidated Financial Statements
and related notes.
SELECTED QUARTERLY FINANCIAL DATA (Unaudited)
Three Months Ended
Dec. 31, Sep. 30, Jun. 30, Mar. 31, Dec. 31, Sep. 30, Jun. 30, Mar. 31,
(In thousands, except per-share data) 2014 2014 2014 2014 2013 2013 2013 2013
Net interest income $204,074 $204,180 $206,101 $201,274 $201,862 $199,627 $202,044 $199,091
Provision for credit losses 55,597 15,739 9,909 14,492 22,792 24,602 32,591 38,383
Net interest income after provision for credit
losses 148,477 188,441 196,192 186,782 179,070 175,025 169,453 160,708
Non-interest income 109,768 116,076 104,016 103,407 105,412 106,160 99,783 92,703
Non-interest expense 221,758 219,688 213,195 217,136 220,469 212,232 208,516 204,052
Income before income tax expense 36,487 84,829 87,013 73,053 64,013 68,953 60,720 49,359
Income tax expense 11,011 30,791 31,385 26,579 22,791 24,551 19,444 17,559
Income after income tax expense 25,476 54,038 55,628 46,474 41,222 44,402 41,276 31,800
Income attributable to non-controlling interest 1,488 1,721 2,503 1,717 1,227 1,607 2,372 1,826
Preferred stock dividends 4,847 4,847 4,847 4,847 4,847 4,847 4,847 4,524
Net income available to common stockholders $ 19,141 $ 47,470 $ 48,278 $ 39,910 $ 35,148 $ 37,948 $ 34,057 $ 25,450
Per common share:
Basic earnings $ 0.12 $ 0.29 $ 0.30 $ 0.25 $ 0.22 $ 0.24 $ 0.21 $ 0.16
Diluted earnings $ 0.12 $ 0.29 $ 0.29 $ 0.24 $ 0.22 $ 0.23 $ 0.21 $ 0.16
102