TCF Bank 2014 Annual Report Download - page 106
Download and view the complete annual report
Please find page 106 of the 2014 TCF Bank annual report below. You can navigate through the pages in the report by either clicking on the pages listed below, or by using the keyword search tool below to find specific information within the annual report.-
 1
1 -
2
-
3
-
4
-
5
-
6
-
7
-
8
-
9
-
10
-
11
-
12
-
13
-
14
-
15
-
16
-
17
-
18
-
19
-
20
-
21
-
22
-
23
-
24
-
25
-
26
-
27
-
28
-
29
-
30
-
31
-
32
-
33
-
34
-
35
-
36
-
37
-
38
-
39
-
40
-
41
-
42
-
43
-
44
-
45
-
46
-
47
-
48
-
49
-
50
-
51
-
52
-
53
-
54
-
55
-
56
-
57
-
58
-
59
-
60
-
61
-
62
-
63
-
64
-
65
-
66
-
67
-
68
-
69
-
70
-
71
-
72
-
73
-
74
-
75
-
76
-
77
-
78
-
79
-
80
-
81
-
82
-
83
-
84
-
85
-
86
-
87
-
88
-
89
-
90
-
91
-
92
-
93
-
94
-
95
-
 96
96 -
 97
97 -
 98
98 -
 99
99 -
 100
100 -
 101
101 -
 102
102 -
 103
103 -
 104
104 -
 105
105 -
 106
106 -
 107
107 -
 108
108 -
 109
109 -
 110
110 -
 111
111 -
 112
112 -
 113
113 -
 114
114 -
 115
115 -
 116
116 -
117
-
118
-
119
-
120
-
121
-
122
-
123
-
124
-
125
-
126
-
127
-
128
-
129
-
130
-
131
-
132
-
133
-
134
-
135
 |
 |

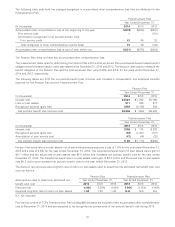
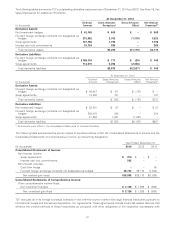
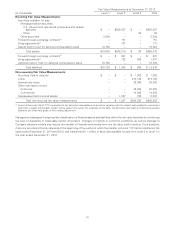
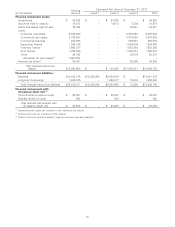
The following tables present the carrying amounts and estimated fair values of the Company’s financial instruments, excluding
short-term financial assets and liabilities as their carrying amounts approximate fair value and excluding financial instruments
recorded at fair value on a recurring basis. This information represents only a portion of TCF’s balance sheet and not the
estimated value of the Company as a whole. Non-financial instruments such as the intangible value of TCF’s branches and core
deposits, leasing operations, goodwill, premises and equipment and the future revenues from TCF’s customers are not reflected
in this disclosure. Therefore, this information is of limited use in assessing the value of TCF.
Estimated Fair Value at December 31, 2014
Carrying
(In thousands) Amount Level 1 Level 2 Level 3 Total
Financial instrument assets:
Investments $ 85,492 $ – $ 85,492 $ – $ 85,492
Securities held to maturity 214,454 – 217,418 4,916 222,334
Loans and leases held for sale 132,266 – – 139,370 139,370
Loans:
Consumer real estate 5,682,364 – – 5,836,770 5,836,770
Commercial real estate 2,624,255 – – 2,575,625 2,575,625
Commercial business 533,410 – – 512,083 512,083
Equipment finance 1,806,808 – – 1,787,271 1,787,271
Inventory finance 1,877,090 – – 1,864,786 1,864,786
Auto finance 1,915,061 – – 1,927,384 1,927,384
Other 24,144 – – 18,724 18,724
Allowance for loan losses(1) (164,169) – – – –
Interest-only strips(2) 69,789 – – 73,058 73,058
Total financial instrument assets $14,800,964 $ – $ 302,910 $14,739,987 $15,042,897
Financial instrument liabilities:
Deposits $15,449,882 $12,400,693 $3,063,850 $ – $15,464,543
Long-term borrowings 1,232,065 – 1,246,221 8,054 1,254,275
Total financial instrument liabilities $16,681,947 $12,400,693 $4,310,071 $ 8,054 $16,718,818
Financial instruments with off-balance
sheet risk:(3)
Commitments to extend credit $ 25,885 $ – $ 25,885 $ – $ 25,885
Standby letters of credit (47) – (47) – (47)
Total financial instruments with
off-balance sheet risk $ 25,838 $ – $ 25,838 $ – $ 25,838
(1) Expected credit losses are included in the estimated fair values.
(2) Carrying amounts are included in other assets.
(3) Positive amounts represent assets, negative amounts represent liabilities.
93