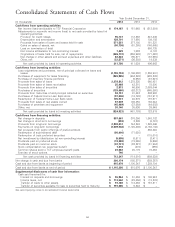
TCF Bank 2014 Annual Report Download - page 79
Download and view the complete annual report
Please find page 79 of the 2014 TCF Bank annual report below. You can navigate through the pages in the report by either clicking on the pages listed below, or by using the keyword search tool below to find specific information within the annual report.-
 1
1 -
2
-
3
-
4
-
5
-
6
-
7
-
8
-
9
-
10
-
11
-
12
-
13
-
14
-
15
-
16
-
17
-
18
-
19
-
20
-
21
-
22
-
23
-
24
-
25
-
26
-
27
-
28
-
29
-
30
-
31
-
32
-
33
-
34
-
35
-
36
-
37
-
38
-
39
-
40
-
41
-
42
-
43
-
44
-
45
-
46
-
47
-
48
-
49
-
50
-
51
-
52
-
53
-
54
-
55
-
56
-
57
-
58
-
59
-
60
-
61
-
62
-
63
-
64
-
65
-
66
-
67
-
68
-
 69
69 -
 70
70 -
 71
71 -
 72
72 -
 73
73 -
 74
74 -
 75
75 -
 76
76 -
 77
77 -
 78
78 -
 79
79 -
 80
80 -
 81
81 -
 82
82 -
 83
83 -
 84
84 -
 85
85 -
 86
86 -
 87
87 -
 88
88 -
 89
89 -
90
-
91
-
92
-
93
-
94
-
95
-
96
-
97
-
98
-
99
-
100
-
101
-
102
-
103
-
104
-
105
-
106
-
107
-
108
-
109
-
110
-
111
-
112
-
113
-
114
-
115
-
116
-
117
-
118
-
119
-
120
-
121
-
122
-
123
-
124
-
125
-
126
-
127
-
128
-
129
-
130
-
131
-
132
-
133
-
134
-
135
 |
 |

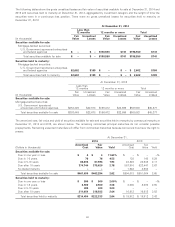
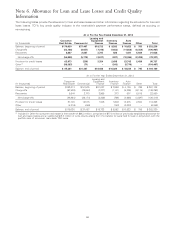
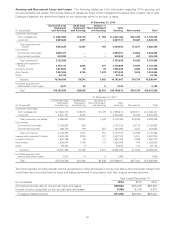
Note 6. Allowance for Loan and Lease Losses and Credit Quality
Information
The following tables provide the allowance for loan and lease losses and other information regarding the allowance for loan and
lease losses. TCF’s key credit quality indicator is the receivable’s payment performance status, defined as accruing or
non-accruing.
At or For the Year Ended December 31, 2014
Leasing and
Consumer Equipment Inventory Auto
(In thousands) Real Estate Commercial Finance Finance Finance Other Total
Balance, beginning of period $176,030 $37,467 $18,733 $ 8,592 $ 10,623 $ 785 $ 252,230
Charge-offs (63,126) (8,657) (7,316) (1,653) (11,856) (8,359) (100,967)
Recoveries 6,867 2,887 3,705 826 1,491 5,860 21,636
Net charge-offs (56,259) (5,770) (3,611) (827) (10,365) (2,499) (79,331)
Provision for credit losses 63,973 (259) 3,324 2,498 23,742 2,459 95,737
Other(1) (98,383) (71) – (243) (5,770) – (104,467)
Balance, end of period $ 85,361 $31,367 $18,446 $10,020 $ 18,230 $ 745 $ 164,169
At or For the Year Ended December 31, 2013
Leasing and
Consumer Equipment Inventory Auto
(In thousands) Real Estate Commercial Finance Finance Finance Other Total
Balance, beginning of period $182,013 $ 51,575 $21,037 $ 7,569 $ 4,136 $ 798 $ 267,128
Charge-offs (97,508) (28,944) (7,277) (1,141) (5,305) (9,115) (149,290)
Recoveries 8,644 2,770 3,968 373 607 6,518 22,880
Net charge-offs (88,864) (26,174) (3,309) (768) (4,698) (2,597) (126,410)
Provision for credit losses 87,100 12,515 1,005 1,949 13,215 2,584 118,368
Other (4,219) (449) – (158) (2,030) – (6,856)
Balance, end of period $176,030 $ 37,467 $18,733 $ 8,592 $10,623 $ 785 $ 252,230
(1) Included in Other for consumer real estate is the transfer of $95.3 million, comprised of $77.0 million of previously established allowance for
loan and lease losses and an additional $18.3 million of write-downs arising from the transfer to loans held for sale in conjunction with the
portfolio sale of consumer real estate TDR loans.
66