TCF Bank 2014 Annual Report Download - page 132
Download and view the complete annual report
Please find page 132 of the 2014 TCF Bank annual report below. You can navigate through the pages in the report by either clicking on the pages listed below, or by using the keyword search tool below to find specific information within the annual report.-
 1
1 -
2
-
3
-
4
-
5
-
6
-
7
-
8
-
9
-
10
-
11
-
12
-
13
-
14
-
15
-
16
-
17
-
18
-
19
-
20
-
21
-
22
-
23
-
24
-
25
-
26
-
27
-
28
-
29
-
30
-
31
-
32
-
33
-
34
-
35
-
36
-
37
-
38
-
39
-
40
-
41
-
42
-
43
-
44
-
45
-
46
-
47
-
48
-
49
-
50
-
51
-
52
-
53
-
54
-
55
-
56
-
57
-
58
-
59
-
60
-
61
-
62
-
63
-
64
-
65
-
66
-
67
-
68
-
69
-
70
-
71
-
72
-
73
-
74
-
75
-
76
-
77
-
78
-
79
-
80
-
81
-
82
-
83
-
84
-
85
-
86
-
87
-
88
-
89
-
90
-
91
-
92
-
93
-
94
-
95
-
96
-
97
-
98
-
99
-
100
-
101
-
102
-
103
-
104
-
105
-
106
-
107
-
108
-
109
-
110
-
111
-
112
-
113
-
114
-
115
-
116
-
117
-
118
-
119
-
120
-
121
-
 122
122 -
 123
123 -
 124
124 -
 125
125 -
 126
126 -
 127
127 -
 128
128 -
 129
129 -
 130
130 -
 131
131 -
 132
132 -
 133
133 -
 134
134 -
 135
135
 |
 |
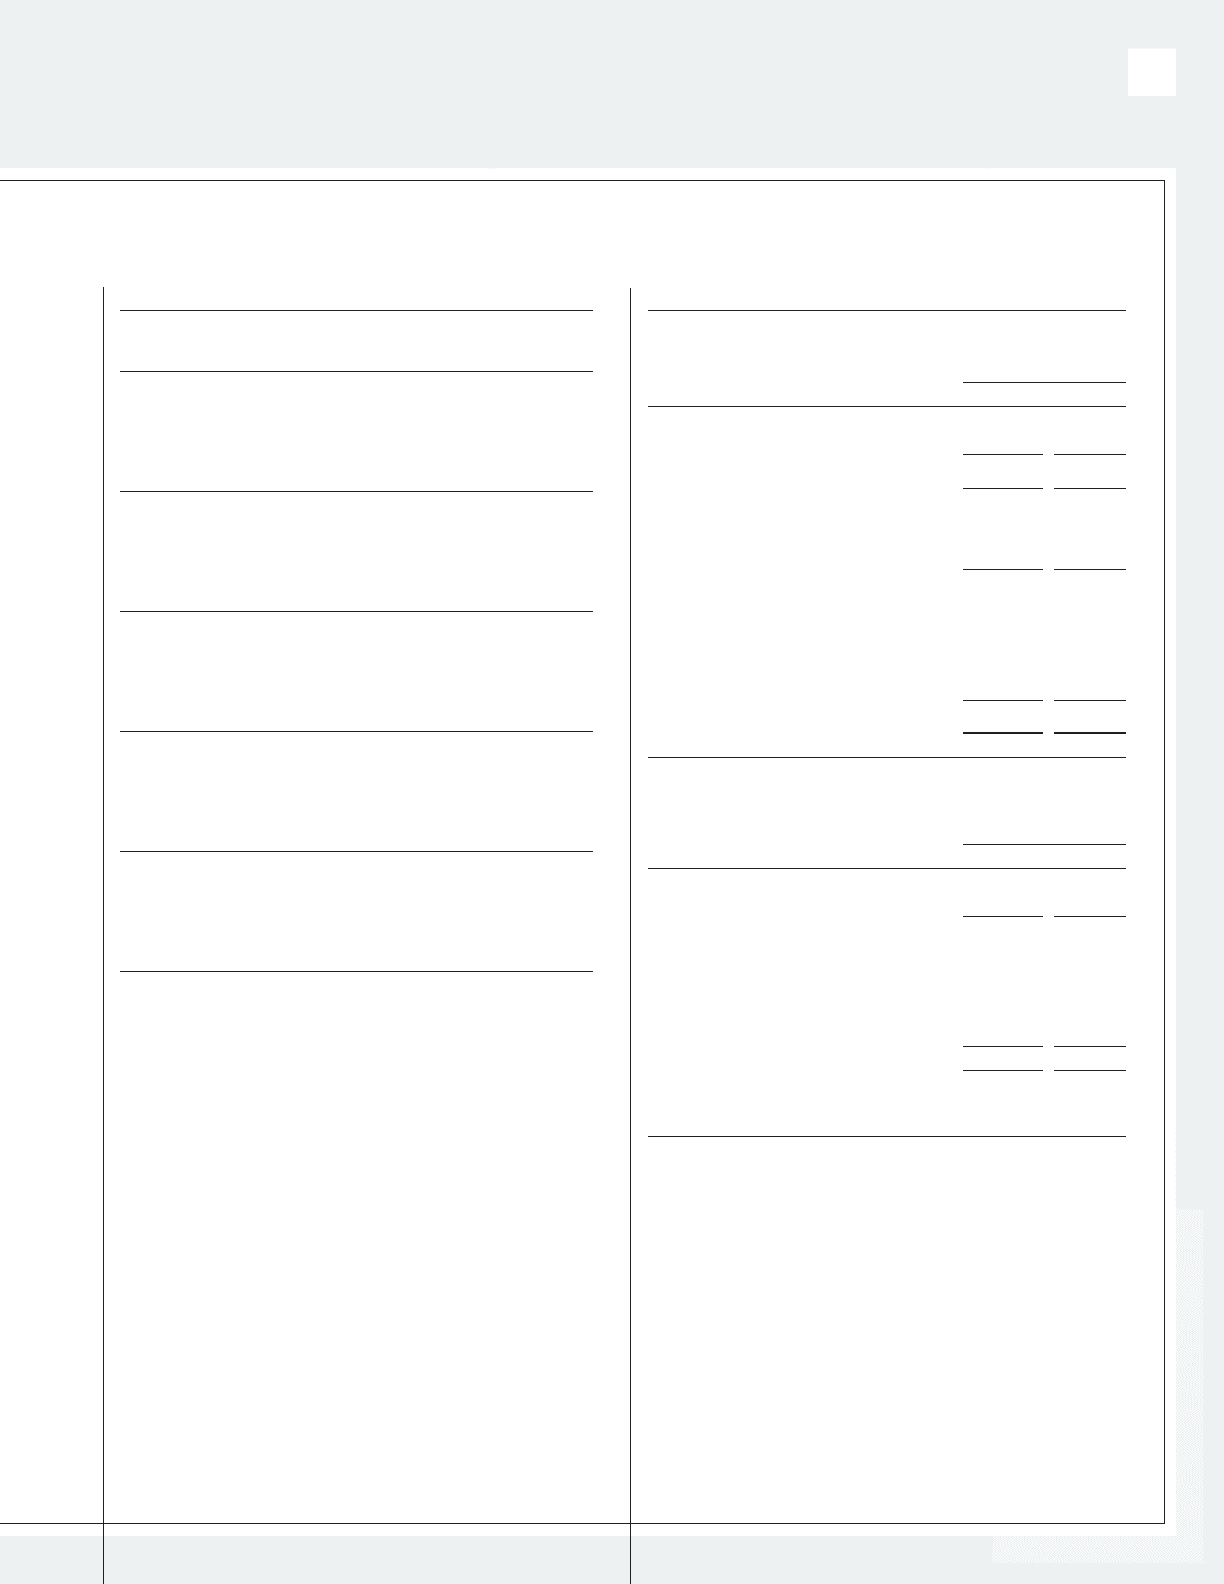
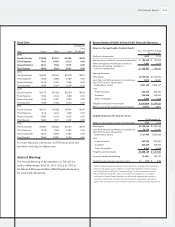
Stock Data
Year Close High Low
Dividends
Paid
Per Share
2014
Fourth Quarter $15.89 $16.12 $13.95 $0.05
Third Quarter 15.53 16.95 15.12 0.05
Second Quarter 16.37 17.30 15.01 0.05
First Quarter 16.66 17.39 15.31 0.05
2013
Fourth Quarter $16.25 $16.46 $14.29 $0.05
Third Quarter 14.28 16.68 13.69 0.05
Second Quarter 14.18 15.32 13.49 0.05
First Quarter 14.96 15.04 12.39 0.05
2012
Fourth Quarter $12.15 $12.49 $10.45 $0.05
Third Quarter 11.94 12.43 9.59 0.05
Second Quarter 11.48 12.53 10.43 0.05
First Quarter 11.89 12.58 10.04 0.05
2 011
Fourth Quarter $10.32 $11.68 $ 8.61 $0.05
Third Quarter 9.16 14.37 8.66 0.05
Second Quarter 13.80 16.04 13.37 0.05
First Quarter 15.86 17.37 14.60 0.05
2010
Fourth Quarter $14.81 $16.63 $12.90 $0.05
Third Quarter 16.19 17.66 13.87 0.05
Second Quarter 16.61 18.89 14.95 0.05
First Quarter 15.94 16.83 13.40 0.05
For more historical information on TCF’s stock price and
dividend, visit http://ir.tcfbank.com.
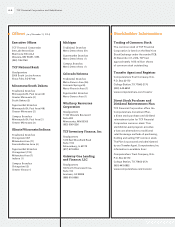
Annual Meeting
The Annual Meeting of Stockholders of TCF will be
held on Wednesday, April 22, 2015, 4:00 p.m. CDT at
the Marriott Minneapolis West, 9960 Wayzata Boulevard,
St. Louis Park, Minnesota.
Reconciliation of GAAP to Non-GAAP Financial Measures
Return on Average Tangible Common Equity1
At or For the Year Ended
December 31,
(Dollars in thousands) 2014 2013
Net income available to common stockholders $ 154,799 $ 132,603
Other intangibles amortization, net of tax 1,062 1,479
Adjusted net income available to
common stockholders $ 155,861 134,082
Average balances:
Total equity $2,058,442 $1,912,622
Less: Non-controlling interest in subsidiaries 17,014 16,491
Total TCF Financial Corporation
stockholders’ equity 2,041,428 1,896,131
Less:
Preferred stock 263,240 263,240
Goodwill 225,640 225,640
Other intangibles 5,498 7,418
Tangible average common equity $ 1,547,050 $1,399,833
Return on average tangible common equity 10.08% 9.58%
Tangible Book Value Per Common Share1
At December 31,
(Dollars in thousands, except per-share data) 2014 2013
Total equity $2,135,364 $1,964,759
Less: Non-controlling interest in subsidiaries 13,715 11,791
Total TCF Financial Corporation
stockholders’ equity 2,121,649 1,952,968
Less:
Preferred stock 263,240 263,240
Goodwill 225,640 225,640
Other intangibles 4,641 6,326
Tangible common equity $1,628,128 $ 1,457,762
Common shares outstanding 167,461 165,122
Tangible book value per common share $ 9.72 $ 8.83
1 When evaluating capital adequacy and utilization, management considers
fi nancial measures such as Return on Average Tangible Common Equity
and Tangible Book Value Per Common Share. These measures are non-
GAAP fi nancial measures and are viewed by management as useful
indicators of capital levels available to withstand unexpected market or
economic conditions, and also provide investors, regulators, and other
users with information to be viewed in relation to other banking institutions.
A-52014 Annual Report