TCF Bank 2014 Annual Report Download - page 32
Download and view the complete annual report
Please find page 32 of the 2014 TCF Bank annual report below. You can navigate through the pages in the report by either clicking on the pages listed below, or by using the keyword search tool below to find specific information within the annual report.-
 1
1 -
2
-
3
-
4
-
5
-
6
-
7
-
8
-
9
-
10
-
11
-
12
-
13
-
14
-
15
-
16
-
17
-
18
-
19
-
20
-
21
-
 22
22 -
 23
23 -
 24
24 -
 25
25 -
 26
26 -
 27
27 -
 28
28 -
 29
29 -
 30
30 -
 31
31 -
 32
32 -
 33
33 -
 34
34 -
 35
35 -
 36
36 -
 37
37 -
 38
38 -
 39
39 -
 40
40 -
 41
41 -
 42
42 -
43
-
44
-
45
-
46
-
47
-
48
-
49
-
50
-
51
-
52
-
53
-
54
-
55
-
56
-
57
-
58
-
59
-
60
-
61
-
62
-
63
-
64
-
65
-
66
-
67
-
68
-
69
-
70
-
71
-
72
-
73
-
74
-
75
-
76
-
77
-
78
-
79
-
80
-
81
-
82
-
83
-
84
-
85
-
86
-
87
-
88
-
89
-
90
-
91
-
92
-
93
-
94
-
95
-
96
-
97
-
98
-
99
-
100
-
101
-
102
-
103
-
104
-
105
-
106
-
107
-
108
-
109
-
110
-
111
-
112
-
113
-
114
-
115
-
116
-
117
-
118
-
119
-
120
-
121
-
122
-
123
-
124
-
125
-
126
-
127
-
128
-
129
-
130
-
131
-
132
-
133
-
134
-
135
 |
 |
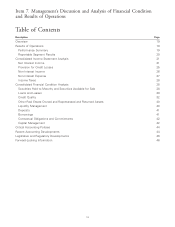
Management’s discussion and analysis of the consolidated financial condition and results of operations of TCF Financial
Corporation should be read in conjunction with ‘‘Part I, Item 1A. Risk Factors,’’ ‘‘Item 6. Selected Financial Data’’ and ‘‘Item 8.
Consolidated Financial Statements.’’
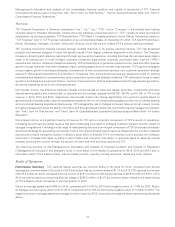
Overview
TCF Financial Corporation, a Delaware corporation (‘‘we,’’ ‘‘us,’’ ‘‘our,’’ ‘‘TCF,’’ or the ‘‘Company’’), is a national bank holding
company based in Wayzata, Minnesota. Unless otherwise indicated, references herein to ‘‘TCF’’ include its direct and indirect
subsidiaries. Its principal subsidiary, TCF National Bank (‘‘TCF Bank’’), is headquartered in South Dakota. References herein to
‘‘TCF Financial’’ refer to TCF Financial Corporation on an unconsolidated basis. At December 31, 2014, TCF had 379 branches in
Illinois, Minnesota, Michigan, Colorado, Wisconsin, Arizona, South Dakota and Indiana (TCF’s primary banking markets).
TCF provides convenient financial services through multiple channels in its primary banking markets. TCF has developed
products and services designed to meet the specific needs of the largest consumer segments in the market. The Company
focuses on attracting and retaining customers through service and convenience, including branches that are open seven days a
week in all markets and on most holidays, extensive full-service supermarket branches, automated teller machine (‘‘ATM’’)
networks and internet, mobile and telephone banking. TCF’s philosophy is to generate interest income, fees and other revenue
growth through business lines that emphasize higher yielding assets and low interest cost deposits. TCF’s growth strategies
include organic growth in existing businesses, development of new products and services, new customer acquisition through
electronic channels and acquisitions of portfolios or companies. New products and services are designed to build on existing
businesses and expand into complementary products and services through strategic initiatives. TCF continues to focus on asset
growth in its leasing and equipment finance, inventory finance and auto finance businesses funded through deposit generation,
as well as expanding its junior lien lending business.
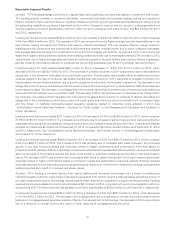
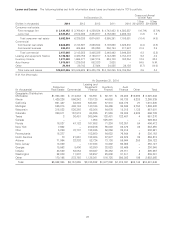
Net interest income, the difference between interest income earned on loans and leases, securities, investments and other
interest-earning assets and interest paid on deposits and borrowings, represented 65.3%, 66.5% and 61.4% of TCF’s total
revenue in 2014, 2013 and 2012, respectively. Net interest income can change significantly from period to period based on
general levels of interest rates, customer prepayment patterns, the mix of interest-earning assets and the mix of interest-bearing
and non-interest bearing deposits and borrowings. TCF manages the risk of changes in interest rates on its net interest income
through a management Asset & Liability Committee and through related interest-rate risk monitoring and management policies.
See ‘‘Part I, Item 1A. Risk Factors’’ and ‘‘Part II, Item 7A. Quantitative and Qualitative Disclosures about Market Risk’’ for further
discussion.
Non-interest income is a significant source of revenue for TCF and an important component of TCF’s results of operations.
Increasing fee and service charge revenue has been challenging as a result of changing customer behavior and the impact of
changes in regulations. Providing a wide range of retail banking services is an integral component of TCF’s business philosophy
and a major strategy for generating non-interest income. Key drivers of bank fees and service charges are the number of deposit
accounts and related transaction activity. In addition, as an effort to diversify TCF’s non-interest income sources, the Company
continues to increase loan sales, primarily in auto finance and consumer real estate, to generate gains on sales as well as
increase servicing fee income through the growth of loans sold with servicing retained by TCF.
The following portions of this Management’s Discussion and Analysis of Financial Condition and Results of Operations
(‘‘Management’s Discussion and Analysis’’) focus in more detail on the results of operations for 2014, 2013 and 2012 and on
information about TCF’s balance sheet, loan and lease portfolio, liquidity, funding resources, capital and other matters.
Results of Operations
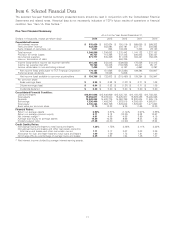
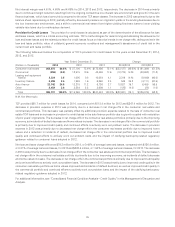
Performance Summary TCF reported diluted earnings per common share of 94 cents for 2014, compared with diluted
earnings per common share of 82 cents for 2013 and diluted loss per common share of $1.37 for 2012. TCF reported net income
of $174.2 million for 2014, compared with net income of $151.7 million for 2013 and a net loss of $212.9 million for 2012. TCF’s
2012 net loss included a non-recurring after-tax charge of $295.8 million, or $1.87 per common share, related to the repositioning
of TCF’s balance sheet completed in the first quarter of 2012.
Return on average assets was 0.96% for 2014, compared with 0.87% for 2013 and a negative return of 1.14% for 2012. Return
on average common equity was 8.71% for 2014, compared with 8.12% for 2013 and a negative return of 13.33% for 2012. The
negative returns on average assets and average common equity for 2012 were due to the balance sheet repositioning discussed
above.
19