TCF Bank 2014 Annual Report Download - page 3
Download and view the complete annual report
Please find page 3 of the 2014 TCF Bank annual report below. You can navigate through the pages in the report by either clicking on the pages listed below, or by using the keyword search tool below to find specific information within the annual report.-
 1
1 -
 2
2 -
 3
3 -
 4
4 -
 5
5 -
 6
6 -
 7
7 -
 8
8 -
 9
9 -
 10
10 -
 11
11 -
 12
12 -
 13
13 -
 14
14 -
15
-
16
-
17
-
18
-
19
-
20
-
21
-
22
-
23
-
24
-
25
-
26
-
27
-
28
-
29
-
30
-
31
-
32
-
33
-
34
-
35
-
36
-
37
-
38
-
39
-
40
-
41
-
42
-
43
-
44
-
45
-
46
-
47
-
48
-
49
-
50
-
51
-
52
-
53
-
54
-
55
-
56
-
57
-
58
-
59
-
60
-
61
-
62
-
63
-
64
-
65
-
66
-
67
-
68
-
69
-
70
-
71
-
72
-
73
-
74
-
75
-
76
-
77
-
78
-
79
-
80
-
81
-
82
-
83
-
84
-
85
-
86
-
87
-
88
-
89
-
90
-
91
-
92
-
93
-
94
-
95
-
96
-
97
-
98
-
99
-
100
-
101
-
102
-
103
-
104
-
105
-
106
-
107
-
108
-
109
-
110
-
111
-
112
-
113
-
114
-
115
-
116
-
117
-
118
-
119
-
120
-
121
-
122
-
123
-
124
-
125
-
126
-
127
-
128
-
129
-
130
-
131
-
132
-
133
-
134
-
135
 |
 |

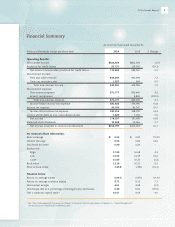
At or For the Year Ended December 31,
(Dollars in thousands, except per-share data) 2014 2013 % Change
Operating Results:
Net interest income $815,629 $802,624 1.6 %
Provision for credit losses 95,737 118,368 (19.1)
Net interest income after provision for credit losses 719,892 684,256 5.2
Non-interest income:
Fees and other revenue 432,240 403,094 7.2
Gains on securities, net 1,027 964 6.5
Total non-interest income 433,267 404,058 7.2
Non-interest expense:
Non-interest expense 871,777 836,400 4.2
Branch realignment – 8,869 (100.0)
Total non-interest expense 871,777 845,269 3.1
Income before income tax expense 281,382 243,045 15.8
Income tax expense 99,766 84,345 18.3
Income after income tax expense 181,616 158,700 14.4
Income attributable to non-controlling interest 7,429 7,032 5.6
Net income 174,187 151,668 14.8
Preferred stock dividends 19,388 19,065 1.7
Net income available to common stockholders $154,799 $132,603 16.7
Per Common Share Information:
Basic earnings $ 0.95 $ 0.82 15.9 %
Diluted earnings 0.94 0.82 14.6
Dividends declared 0.20 0.20 –
Stock price:
High 17.39 16.68 4.3
Low 13.95 12.39 12.6
Close 15.89 16.25 (2.2)
Book value 11.10 10.23 8.5
Price to book value 1.43 X 1.59 X (10.1)
Financial Ratios:
Return on average assets 0.96 % 0.87 % 10.3 %
Return on average common equity 8.71 8.12 7.3
Net interest margin 4.61 4.68 (1.5)
Net charge-offs as a percentage of average loans and leases 0.49 0.81 (39.5)
Tier 1 common capital ratio(1) 10.07 9.63 4.6
(1)
See “Item 7. Management’s Discussion and Analysis of Financial Condition and Results of Operations — Capital Management”
(for reconciliation of GAAP to non-GAAP measures).
Financial Summary
12014 Annual Report