TCF Bank 2014 Annual Report Download - page 36
Download and view the complete annual report
Please find page 36 of the 2014 TCF Bank annual report below. You can navigate through the pages in the report by either clicking on the pages listed below, or by using the keyword search tool below to find specific information within the annual report.-
 1
1 -
2
-
3
-
4
-
5
-
6
-
7
-
8
-
9
-
10
-
11
-
12
-
13
-
14
-
15
-
16
-
17
-
18
-
19
-
20
-
21
-
22
-
23
-
24
-
25
-
 26
26 -
 27
27 -
 28
28 -
 29
29 -
 30
30 -
 31
31 -
 32
32 -
 33
33 -
 34
34 -
 35
35 -
 36
36 -
 37
37 -
 38
38 -
 39
39 -
 40
40 -
 41
41 -
 42
42 -
 43
43 -
 44
44 -
 45
45 -
 46
46 -
47
-
48
-
49
-
50
-
51
-
52
-
53
-
54
-
55
-
56
-
57
-
58
-
59
-
60
-
61
-
62
-
63
-
64
-
65
-
66
-
67
-
68
-
69
-
70
-
71
-
72
-
73
-
74
-
75
-
76
-
77
-
78
-
79
-
80
-
81
-
82
-
83
-
84
-
85
-
86
-
87
-
88
-
89
-
90
-
91
-
92
-
93
-
94
-
95
-
96
-
97
-
98
-
99
-
100
-
101
-
102
-
103
-
104
-
105
-
106
-
107
-
108
-
109
-
110
-
111
-
112
-
113
-
114
-
115
-
116
-
117
-
118
-
119
-
120
-
121
-
122
-
123
-
124
-
125
-
126
-
127
-
128
-
129
-
130
-
131
-
132
-
133
-
134
-
135
 |
 |

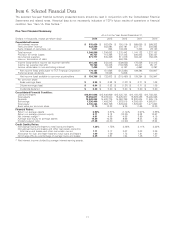
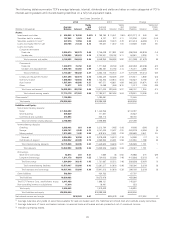
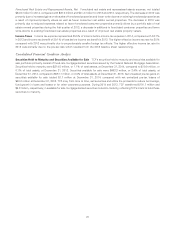
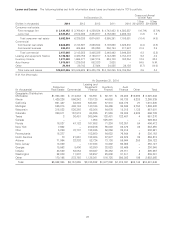
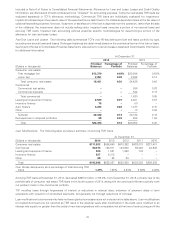
Year Ended December 31,
2013 2012 Change
Yields Yields Yields and
Average and Average and Average Rates
(Dollars in thousands) Balance Interest Rates Balance Interest Rates Balance Interest (bps)
Assets:
Investments and other $ 768,180 $ 15,041 1.96% $ 567,907 $ 10,123 1.78% $ 200,273 $ 4,918 18
Securities held to maturity 6,737 277 4.11 6,515 281 4.31 222 (4) (20)
Securities available for sale(1) 648,630 18,074 2.79 1,056,048 35,150 3.33 (407,418) (17,076) (54)
Loans and leases held for sale 155,337 11,647 7.50 46,201 3,689 7.98 109,136 7,958 (48)
Loans and leases:
Consumer real estate:
Fixed-rate 3,746,029 217,891 5.82 4,254,039 252,233 5.93 (508,010) (34,342) (11)
Variable-rate 2,703,921 138,192 5.11 2,503,473 126,158 5.04 200,448 12,034 7
Total consumer real estate 6,449,950 356,083 5.52 6,757,512 378,391 5.60 (307,562) (22,308) (8)
Commercial:
Fixed-rate 1,771,959 93,760 5.29 1,975,669 109,588 5.55 (203,710) (15,828) (26)
Variable- and adjustable-rate 1,490,787 61,752 4.14 1,509,549 70,858 4.69 (18,762) (9,106) (55)
Total commercial 3,262,746 155,512 4.77 3,485,218 180,446 5.18 (222,472) (24,934) (41)
Leasing and equipment finance 3,260,425 162,035 4.97 3,155,946 170,991 5.42 104,479 (8,956) (45)
Inventory finance 1,723,253 103,844 6.03 1,434,643 88,934 6.20 288,610 14,910 (17)
Auto finance 907,571 43,921 4.84 296,083 17,949 6.06 611,488 25,972 (122)
Other 13,088 1,060 8.10 16,549 1,332 8.05 (3,461) (272) 5
Total loans and leases(2) 15,617,033 822,455 5.27 15,145,951 838,043 5.53 471,082 (15,588) (26)
Total interest-earning assets 17,195,917 867,494 5.04 16,822,622 887,286 5.27 373,295 (19,792) (23)
Other assets(3) 1,092,681 1,233,042 (140,361)
Total assets $18,288,598 $18,055,664 $ 232,934
Liabilities and Equity:
Non-interest bearing deposits:
Retail $ 1,442,356 $ 1,311,561 $ 130,795
Small business 771,827 738,949 32,878
Commercial and custodial 345,713 317,432 28,281
Total non-interest bearing deposits 2,559,896 2,367,942 191,954
Interest-bearing deposits:
Checking 2,313,794 1,485 0.06 2,256,237 3,105 0.14 57,557 (1,620) (8)
Savings 6,147,030 12,437 0.20 6,037,939 19,834 0.33 109,091 (7,397) (13)
Money market 818,814 2,391 0.29 770,104 2,859 0.37 48,710 (468) (8)
Subtotal 9,279,638 16,313 0.18 9,064,280 25,798 0.28 215,358 (9,485) (10)
Certificates of deposit 2,369,992 20,291 0.86 1,727,859 15,189 0.88 642,133 5,102 (2)
Total interest-bearing deposits 11,649,630 36,604 0.31 10,792,139 40,987 0.38 857,491 (4,383) (7)
Total deposits 14,209,526 36,604 0.26 13,160,081 40,987 0.31 1,049,445 (4,383) (5)
Borrowings:
Short-term borrowings 7,685 46 0.60 312,417 937 0.30 (304,732) (891) 30
Long-term borrowings 1,724,002 25,266 1.46 2,426,655 62,680 2.58 (702,653) (37,414) (112)
Total borrowings 1,731,687 25,312 1.46 2,739,072 63,617 2.32 (1,007,385) (38,305) (86)
Total interest-bearing liabilities 13,381,317 61,916 0.46 13,531,211 104,604 0.77 (149,894) (42,688) (31)
Total deposits and borrowings 15,941,213 61,916 0.39 15,899,153 104,604 0.66 42,060 (42,688) (27)
Other liabilities 434,763 412,170 22,593
Total liabilities 16,375,976 16,311,323 64,653
Total TCF Financial Corp. stockholders’
equity 1,896,131 1,729,537 166,594
Non-controlling interest in subsidiaries 16,491 14,804 1,687
Total equity 1,912,622 1,744,341 168,281
Total liabilities and equity $18,288,598 $18,055,664 $ 232,934
Net interest income and margin $805,578 4.68 $782,682 4.65 $ 22,896 3
(1) Average balances and yields of securities available for sale are based upon the historical amortized cost and exclude equity securities.
(2) Average balances of loans and leases include non-accrual loans and leases and are presented net of unearned income.
(3) Includes operating leases.
23