TCF Bank 2014 Annual Report Download - page 40
Download and view the complete annual report
Please find page 40 of the 2014 TCF Bank annual report below. You can navigate through the pages in the report by either clicking on the pages listed below, or by using the keyword search tool below to find specific information within the annual report.-
 1
1 -
2
-
3
-
4
-
5
-
6
-
7
-
8
-
9
-
10
-
11
-
12
-
13
-
14
-
15
-
16
-
17
-
18
-
19
-
20
-
21
-
22
-
23
-
24
-
25
-
26
-
27
-
28
-
29
-
 30
30 -
 31
31 -
 32
32 -
 33
33 -
 34
34 -
 35
35 -
 36
36 -
 37
37 -
 38
38 -
 39
39 -
 40
40 -
 41
41 -
 42
42 -
 43
43 -
 44
44 -
 45
45 -
 46
46 -
 47
47 -
 48
48 -
 49
49 -
 50
50 -
51
-
52
-
53
-
54
-
55
-
56
-
57
-
58
-
59
-
60
-
61
-
62
-
63
-
64
-
65
-
66
-
67
-
68
-
69
-
70
-
71
-
72
-
73
-
74
-
75
-
76
-
77
-
78
-
79
-
80
-
81
-
82
-
83
-
84
-
85
-
86
-
87
-
88
-
89
-
90
-
91
-
92
-
93
-
94
-
95
-
96
-
97
-
98
-
99
-
100
-
101
-
102
-
103
-
104
-
105
-
106
-
107
-
108
-
109
-
110
-
111
-
112
-
113
-
114
-
115
-
116
-
117
-
118
-
119
-
120
-
121
-
122
-
123
-
124
-
125
-
126
-
127
-
128
-
129
-
130
-
131
-
132
-
133
-
134
-
135
 |
 |

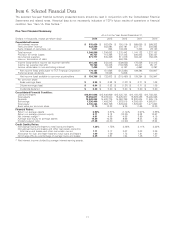
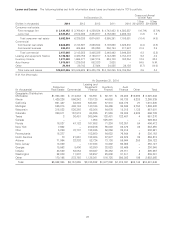
Servicing Fee Income Servicing fee income totaled $21.4 million for 2014, compared with $13.4 million and $7.8 million for
2013 and 2012, respectively. The increases were primarily due to an increase in the portfolio of consumer real estate and auto
loans sold with servicing retained by TCF. Total loans and leases serviced for others was $3.4 billion as of December 31, 2014,
compared to $2.0 billion and $1.0 billion as of December 31, 2013 and 2012, respectively.
Leasing and Equipment Finance Leasing and equipment finance income totaled $93.8 million for 2014, compared with
$90.9 million and $92.2 million for 2013 and 2012, respectively. The increase in 2014 and the decrease in 2013 were primarily due
to customer-driven events impacting sales-type lease revenue.
Gains (Losses) on Securities, Net Gains (losses) on securities, net totaled $1.0 million for 2014, compared with $1.0 million and
$102.2 million for 2013 and 2012, respectively. The gains in 2012 included $90.2 million related to sales of mortgage-backed
securities (including a pre-tax net gain of $77.0 million as a result of the balance sheet repositioning) and a pre-tax net gain of
$13.1 million as a result of the sale of Visa Class B stock.
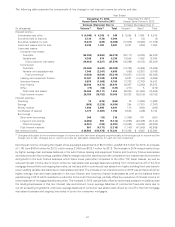
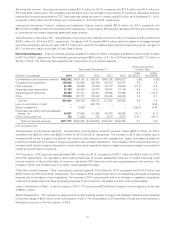
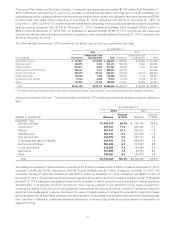
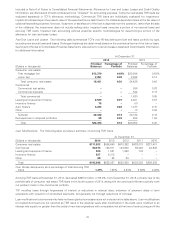
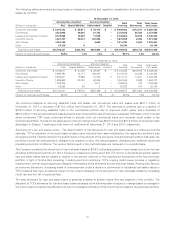
Non-Interest Expense Total non-interest expense was $871.8 million for 2014, compared with $845.3 million and $1.4 billion
for 2013 and 2012, respectively. Non-interest expense increased $26.5 million, or 3.1%, in 2014 and decreased $517.3 million, or
38.0%, in 2013. The following table presents the components of non-interest expense.
Compound Annual
Year Ended December 31, Growth Rate
1-Year 5-Year
(Dollars in thousands) 2014 2013 2012 2011 2010 2014/2013 2014/2009
Compensation and employee benefits $452,942 $429,188 $ 393,841 $348,792 $346,072 5.5% 5.5%
Occupancy and equipment 139,023 134,694 130,792 126,437 126,551 3.2 1.9
FDIC insurance 25,123 32,066 30,425 28,747 23,584 (21.7) 5.6
Operating lease depreciation 27,152 24,500 25,378 30,007 37,106 10.8 4.0
Advertising and marketing 22,943 21,477 25,241 32,925 30,366 6.8 (13.7)
Other 179,904 167,777 163,897 145,489 146,253 7.2 4.7
Subtotal 847,087 809,702 769,574 712,397 709,932 4.6 3.8
Loss on termination of debt –– 550,735 – – – N.M.
Branch realignment –8,869 – – – (100.0) N.M.
Foreclosed real estate and repossessed
assets, net 24,567 27,950 41,358 49,238 40,385 (12.1) (5.1)
Other credit costs, net 123 (1,252) 887 2,816 6,018 N.M. (60.1)
Total non-interest expense $871,777 $845,269 $1,362,554 $764,451 $756,335 3.1 2.9
N.M. Not Meaningful.
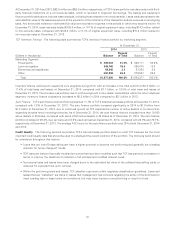
Compensation and Employee Benefits Compensation and employee benefits expense totaled $452.9 million for 2014,
compared with $429.2 million and $393.8 million for 2013 and 2012, respectively. The increase in 2014 was primarily due to
increased staff levels to support the growth and needs of auto finance and risk management, higher commissions based on
production results and an increase in the annual pension plan valuation adjustment. The increase in 2013 was primarily due to
increased staff levels to support the growth of auto finance and expenses related to higher commissions based on production
results and performance incentives.
FDIC Insurance FDIC premium expense totaled $25.1 million for 2014, compared with $32.1 million and $30.4 million for 2013
and 2012, respectively. The decrease in 2014 was primarily due to a lower assessment rate due to overall improving credit
metrics inclusive of the portfolio sale of consumer real estate TDR loans and a non-recurring assessment rate catch-up. The
increase in 2013 was primarily due to a higher overall assessment base.
Other Non-Interest Expense Other non-interest expense totaled $179.9 million for 2014, compared with $167.8 million and
$163.9 million for 2013 and 2012, respectively. The increase in 2014 was primarily due to increased loan and lease processing
expense due to increases in loan originations. The increase in 2013 was primarily due to an increase in regulatory compliance
costs and increased loan and lease processing expense in the consumer real estate and auto finance businesses.
Loss on Termination of Debt In the first quarter of 2012, TCF restructured $3.6 billion of long-term borrowings at a pre-tax loss
of $550.7 million.
Branch Realignment TCF executed a realignment of its retail banking system to support its strategic initiatives which resulted
in a pre-tax charge of $8.9 million in the fourth quarter of 2013. The consolidation of 37 branches in Illinois and nine branches in
Minnesota occurred in the first quarter of 2014.
27