TCF Bank 2014 Annual Report Download - page 49
Download and view the complete annual report
Please find page 49 of the 2014 TCF Bank annual report below. You can navigate through the pages in the report by either clicking on the pages listed below, or by using the keyword search tool below to find specific information within the annual report.-
 1
1 -
2
-
3
-
4
-
5
-
6
-
7
-
8
-
9
-
10
-
11
-
12
-
13
-
14
-
15
-
16
-
17
-
18
-
19
-
20
-
21
-
22
-
23
-
24
-
25
-
26
-
27
-
28
-
29
-
30
-
31
-
32
-
33
-
34
-
35
-
36
-
37
-
38
-
 39
39 -
 40
40 -
 41
41 -
 42
42 -
 43
43 -
 44
44 -
 45
45 -
 46
46 -
 47
47 -
 48
48 -
 49
49 -
 50
50 -
 51
51 -
 52
52 -
 53
53 -
 54
54 -
 55
55 -
 56
56 -
 57
57 -
 58
58 -
 59
59 -
60
-
61
-
62
-
63
-
64
-
65
-
66
-
67
-
68
-
69
-
70
-
71
-
72
-
73
-
74
-
75
-
76
-
77
-
78
-
79
-
80
-
81
-
82
-
83
-
84
-
85
-
86
-
87
-
88
-
89
-
90
-
91
-
92
-
93
-
94
-
95
-
96
-
97
-
98
-
99
-
100
-
101
-
102
-
103
-
104
-
105
-
106
-
107
-
108
-
109
-
110
-
111
-
112
-
113
-
114
-
115
-
116
-
117
-
118
-
119
-
120
-
121
-
122
-
123
-
124
-
125
-
126
-
127
-
128
-
129
-
130
-
131
-
132
-
133
-
134
-
135
 |
 |

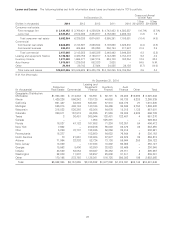
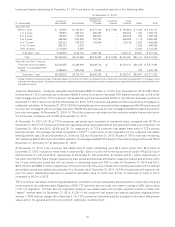
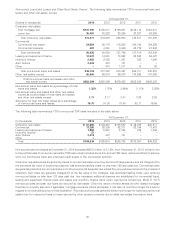
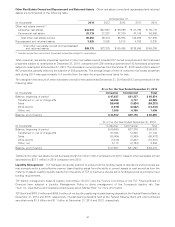
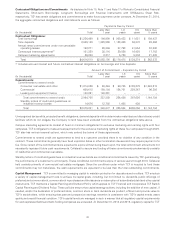
Changes in the amount of non-accrual loans and leases for the years ended December 31, 2014 and 2013 are summarized in the
following tables.
At or For the Year Ended December 31, 2014
Leasing and
Consumer Equipment Inventory Auto
(In thousands) Real Estate Commercial Finance Finance Finance Other Total
Balance, beginning of period $219,033 $ 40,539 $14,041 $ 2,529 $ 470 $ 410 $277,022
Additions 184,385 29,653 18,380 7,107 4,280 92 243,897
Charge-offs (55,107) (8,491) (5,040) (515) (100) (91) (69,344)
Transfers to other assets (62,281) (3,717) (3,027) (306) (135) (12) (69,478)
Return to accrual status (51,269) – (1,683) (2,852) – – (55,804)
Payments received (20,757) (33,401) (9,549) (3,398) (839) (209) (68,153)
Sales (41,458) (607) – – – (189) (42,254)
Other, net 725 1,059 (452) (483) – (1) 848
Balance, end of period $173,271 $ 25,035 $12,670 $ 2,082 $3,676 $ – $216,734
At or For the Year Ended December 31, 2013
Leasing and
Consumer Equipment Inventory Auto
(In thousands) Real Estate Commercial Finance Finance Finance Other Total
Balance, beginning of period $234,900 $127,746 $13,652 $ 1,487 $ 101 $1,571 $379,457
Additions 222,443 13,315 19,219 7,608 497 29 263,111
Charge-offs (38,283) (27,325) (5,461) (721) (10) (173) (71,973)
Transfers to other assets (66,267) (13,885) (2,252) (526) (10) (56) (82,996)
Return to accrual status (71,229) (9,057) (1,748) (3,321) – – (85,355)
Payments received (19,865) (53,985) (9,267) (2,292) (114) (503) (86,026)
Sales (43,434) (309) – – – (453) (44,196)
Other, net 768 4,039 (102) 294 6 (5) 5,000
Balance, end of period $219,033 $ 40,539 $14,041 $ 2,529 $ 470 $ 410 $277,022
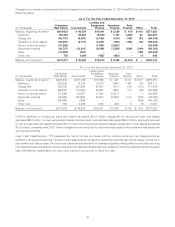
In 2014, additions to non-accrual loans and leases decreased $19.2 million, charge-offs of non-accrual loans and leases
decreased $2.6 million, non-accrual loans and leases that returned to accrual status decreased $29.6 million, payments received
on non-accrual loans and leases decreased $17.9 million and non-accrual loans and leases transferred to other assets decreased
$13.5 million, compared with 2013. These changes were primarily due to improved credit quality in the consumer real estate and
commercial portfolios.
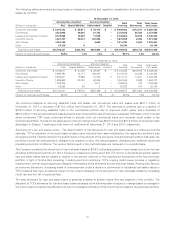
Loan Credit Classifications TCF assesses the risk of its loan and lease portfolio utilizing numerous risk characteristics as
outlined in the previous sections. The loan credit classifications represent an additional characteristic that is closely monitored in
the overall credit risk process. The loan credit classifications derived from standard regulatory rating definitions include: accruing
non-classified (pass and special mention) and accruing classified (substandard and doubtful). Accruing classified loans and leases
have well-defined weaknesses, but may never become non-accrual or result in a loss.
36