TCF Bank 2014 Annual Report Download - page 88
Download and view the complete annual report
Please find page 88 of the 2014 TCF Bank annual report below. You can navigate through the pages in the report by either clicking on the pages listed below, or by using the keyword search tool below to find specific information within the annual report.-
 1
1 -
2
-
3
-
4
-
5
-
6
-
7
-
8
-
9
-
10
-
11
-
12
-
13
-
14
-
15
-
16
-
17
-
18
-
19
-
20
-
21
-
22
-
23
-
24
-
25
-
26
-
27
-
28
-
29
-
30
-
31
-
32
-
33
-
34
-
35
-
36
-
37
-
38
-
39
-
40
-
41
-
42
-
43
-
44
-
45
-
46
-
47
-
48
-
49
-
50
-
51
-
52
-
53
-
54
-
55
-
56
-
57
-
58
-
59
-
60
-
61
-
62
-
63
-
64
-
65
-
66
-
67
-
68
-
69
-
70
-
71
-
72
-
73
-
74
-
75
-
76
-
77
-
 78
78 -
 79
79 -
 80
80 -
 81
81 -
 82
82 -
 83
83 -
 84
84 -
 85
85 -
 86
86 -
 87
87 -
 88
88 -
 89
89 -
 90
90 -
 91
91 -
 92
92 -
 93
93 -
 94
94 -
 95
95 -
 96
96 -
 97
97 -
 98
98 -
99
-
100
-
101
-
102
-
103
-
104
-
105
-
106
-
107
-
108
-
109
-
110
-
111
-
112
-
113
-
114
-
115
-
116
-
117
-
118
-
119
-
120
-
121
-
122
-
123
-
124
-
125
-
126
-
127
-
128
-
129
-
130
-
131
-
132
-
133
-
134
-
135
 |
 |
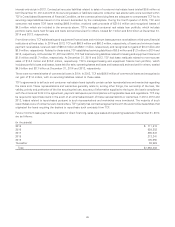
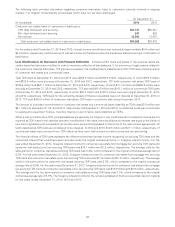
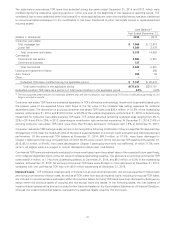
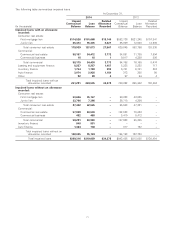
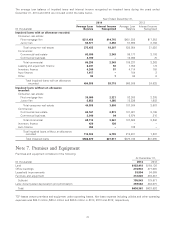
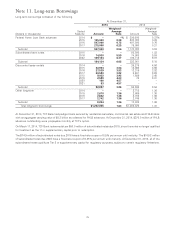
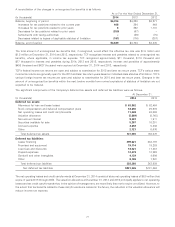
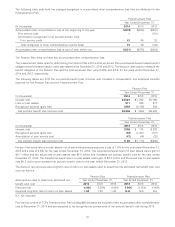
Note 11. Long-term Borrowings
Long-term borrowings consisted of the following.
At December 31,
2014 2013
Weighted- Weighted-
Stated Average Average
(Dollars in thousands) Maturity Amount Rate Amount Rate
Federal Home Loan Bank advances 2014 $– –%$ 398,000 0.37%
2015 125,000 0.38 200,000 0.33
2016 547,000 0.75 497,000 0.76
2017 275,000 0.25 75,000 0.21
Subtotal 947,000 0.56 1,170,000 0.52
Subordinated bank notes 2015 ––50,000 1.83
2016 74,930 5.59 74,868 5.59
2022 109,194 6.37 109,113 6.37
Subtotal 184,124 6.05 233,981 5.15
Discounted lease rentals 2014 ––26,275 4.06
2015 32,904 3.84 18,866 3.96
2016 27,539 3.83 13,319 3.92
2017 20,580 3.82 8,281 3.69
2018 9,032 3.92 1,689 3.45
2019 2,589 4.23 76 3.31
2020 160 4.57 ––
2021 83 4.57 ––
Subtotal 92,887 3.85 68,506 3.94
Other long-term 2014 ––2,718 1.36
2015 2,670 1.36 2,669 1.36
2016 2,642 1.36 2,705 1.36
2017 2,742 1.36 2,746 1.36
Subtotal 8,054 1.36 10,838 1.36
Total long-term borrowings $1,232,065 1.63 $1,483,325 1.41
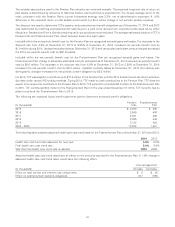
At December 31, 2014, TCF Bank had pledged loans secured by residential real estate, commercial real estate and FHLB stock
with an aggregate carrying value of $5.2 billion as collateral for FHLB advances. At December 31, 2014, $375.0 million of FHLB
advances outstanding were prepayable monthly at TCF’s option.
On March 17, 2014, TCF Bank redeemed at par $50.0 million of subordinated notes due 2015, since the notes no longer qualified
for treatment as Tier 2 or supplementary capital prior to redemption.
The $74.9 million of subordinated notes due 2016 have a fixed-rate coupon of 5.5% per annum until maturity. The $109.2 million
of subordinated notes due 2022 have a fixed-rate coupon of 6.25% per annum until maturity. At December 31, 2014, all of the
subordinated notes qualify as Tier 2 or supplementary capital for regulatory purposes, subject to certain regulatory limitations.
75