TCF Bank 2014 Annual Report Download - page 44
Download and view the complete annual report
Please find page 44 of the 2014 TCF Bank annual report below. You can navigate through the pages in the report by either clicking on the pages listed below, or by using the keyword search tool below to find specific information within the annual report.-
 1
1 -
2
-
3
-
4
-
5
-
6
-
7
-
8
-
9
-
10
-
11
-
12
-
13
-
14
-
15
-
16
-
17
-
18
-
19
-
20
-
21
-
22
-
23
-
24
-
25
-
26
-
27
-
28
-
29
-
30
-
31
-
32
-
33
-
 34
34 -
 35
35 -
 36
36 -
 37
37 -
 38
38 -
 39
39 -
 40
40 -
 41
41 -
 42
42 -
 43
43 -
 44
44 -
 45
45 -
 46
46 -
 47
47 -
 48
48 -
 49
49 -
 50
50 -
 51
51 -
 52
52 -
 53
53 -
 54
54 -
55
-
56
-
57
-
58
-
59
-
60
-
61
-
62
-
63
-
64
-
65
-
66
-
67
-
68
-
69
-
70
-
71
-
72
-
73
-
74
-
75
-
76
-
77
-
78
-
79
-
80
-
81
-
82
-
83
-
84
-
85
-
86
-
87
-
88
-
89
-
90
-
91
-
92
-
93
-
94
-
95
-
96
-
97
-
98
-
99
-
100
-
101
-
102
-
103
-
104
-
105
-
106
-
107
-
108
-
109
-
110
-
111
-
112
-
113
-
114
-
115
-
116
-
117
-
118
-
119
-
120
-
121
-
122
-
123
-
124
-
125
-
126
-
127
-
128
-
129
-
130
-
131
-
132
-
133
-
134
-
135
 |
 |

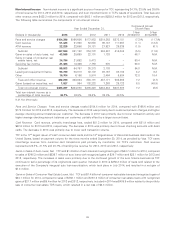
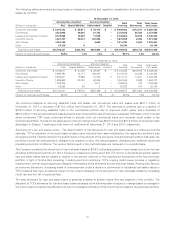
Commercial Real Estate and Business Lending Commercial real estate loans decreased $119.4 million from December 31,
2013 to $2.6 billion at December 31, 2014. The decrease in commercial real estate loans was due to run-off exceeding new
originations as well as continued efforts to actively work out problem loans.Variable and adjustable-rate loans represented 53.9%
of commercial real estate loans outstanding at December 31, 2014, compared with 45.7% at December 31, 2013. At
December 31, 2014, 88.3% of TCF’s commercial real estate loans outstanding were secured by properties located in its primary
banking markets compared with 88.7% at December 31, 2013. Commercial business loans increased $128.8 million to
$533.4 million at December 31, 2014. With an emphasis on secured lending, 99.9% of TCF’s commercial real estate and
commercial business loans were secured either by properties or other business assets at December 31, 2014, compared with
99.0% at December 31, 2013.
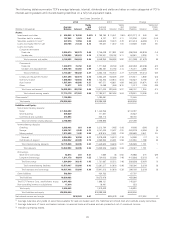
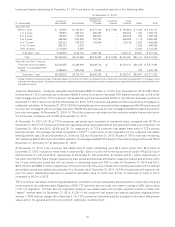
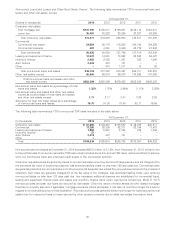
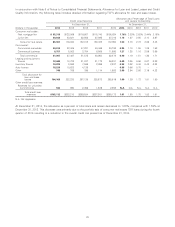
The following table summarizes TCF’s commercial real estate loan portfolio by property and loan type.
At December 31,
2014 2013
Construction and Construction and
(In thousands) Permanent Development Total Permanent Development Total
Multi-family housing $ 816,931 $141,695 $ 958,626 $ 899,604 $ 48,395 $ 947,999
Retail services(1) 364,074 9,104 373,178 558,739 10,804 569,543
Office buildings 372,673 5,294 377,967 349,534 2,034 351,568
Warehouse/industrial buildings 290,157 9,197 299,354 306,322 – 306,322
Health care facilities 229,175 25,176 254,351 193,384 33,516 226,900
Hotels and motels 139,793 7,499 147,292 165,537 2,710 168,247
Residential home builders 12,134 6,398 18,532 13,196 8,245 21,441
Other 157,207 37,748 194,955 118,357 33,320 151,677
Total $2,382,144 $242,111 $2,624,255 $2,604,673 $139,024 $2,743,697
(1) Primarily retail strip shopping centers and malls, convenience stores, supermarkets, restaurants and automobile related businesses.
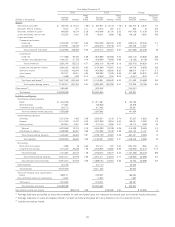
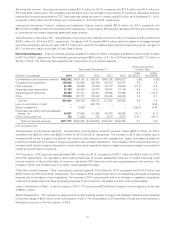
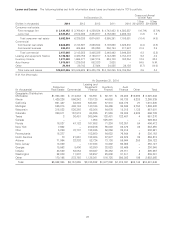
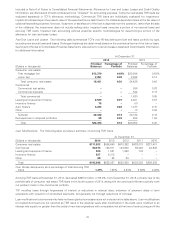
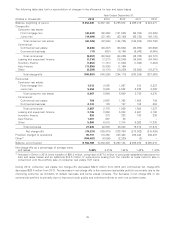
Leasing and Equipment Finance The following table summarizes TCF’s leasing and equipment finance portfolio by equipment
type.
At December 31,
2014 2013
Percent Percent
(Dollars in thousands) Balance of Total Balance of Total
Equipment Type:
Specialty vehicles $1,007,518 26.9% $ 849,150 24.8%
Construction 429,123 11.5 400,425 11.7
Medical 387,514 10.3 393,337 11.5
Manufacturing 365,176 9.8 407,478 11.9
Golf cart and turf 344,979 9.2 327,141 9.5
Technology and data processing 262,146 7.0 260,849 7.6
Furniture and fixtures 252,439 6.7 212,857 6.2
Trucks and trailers 218,664 5.8 150,266 4.4
Agricultural 127,898 3.4 98,582 2.9
Other 349,865 9.4 328,670 9.5
Total $3,745,322 100.0% $3,428,755 100.0%
The leasing and equipment finance portfolio consisted of $1.9 billion of leases and $1.8 billion of loans at December 31, 2014,
increases of 3.0% and 16.9%, respectively, from $1.9 billion of leases and $1.5 billion of loans at December 31, 2013. The
uninstalled backlog of approved transactions was $418.0 million at December 31, 2014, compared with $454.4 million at
December 31, 2013. The average size of transactions originated during 2014 was $118 thousand, compared with $115 thousand
during 2013. TCF’s leasing and equipment finance activity is subject to risk of cyclical downturns and other adverse economic
developments. In an adverse economic environment, there may be a decline in the demand for some types of equipment,
resulting in a decline in the amount of new equipment being placed into service as well as a decline in equipment values for
equipment previously placed in service. Declines in the value of leased equipment increase the potential for impairment losses
and credit losses due to diminished collateral value and may result in lower sales-type revenue at the end of the contractual lease
term. See Note 1 of Notes to Consolidated Financial Statements, Summary of Significant Accounting Policies, for information on
lease accounting.
31