TCF Bank 2014 Annual Report Download - page 42
Download and view the complete annual report
Please find page 42 of the 2014 TCF Bank annual report below. You can navigate through the pages in the report by either clicking on the pages listed below, or by using the keyword search tool below to find specific information within the annual report.-
 1
1 -
2
-
3
-
4
-
5
-
6
-
7
-
8
-
9
-
10
-
11
-
12
-
13
-
14
-
15
-
16
-
17
-
18
-
19
-
20
-
21
-
22
-
23
-
24
-
25
-
26
-
27
-
28
-
29
-
30
-
31
-
 32
32 -
 33
33 -
 34
34 -
 35
35 -
 36
36 -
 37
37 -
 38
38 -
 39
39 -
 40
40 -
 41
41 -
 42
42 -
 43
43 -
 44
44 -
 45
45 -
 46
46 -
 47
47 -
 48
48 -
 49
49 -
 50
50 -
 51
51 -
 52
52 -
53
-
54
-
55
-
56
-
57
-
58
-
59
-
60
-
61
-
62
-
63
-
64
-
65
-
66
-
67
-
68
-
69
-
70
-
71
-
72
-
73
-
74
-
75
-
76
-
77
-
78
-
79
-
80
-
81
-
82
-
83
-
84
-
85
-
86
-
87
-
88
-
89
-
90
-
91
-
92
-
93
-
94
-
95
-
96
-
97
-
98
-
99
-
100
-
101
-
102
-
103
-
104
-
105
-
106
-
107
-
108
-
109
-
110
-
111
-
112
-
113
-
114
-
115
-
116
-
117
-
118
-
119
-
120
-
121
-
122
-
123
-
124
-
125
-
126
-
127
-
128
-
129
-
130
-
131
-
132
-
133
-
134
-
135
 |
 |

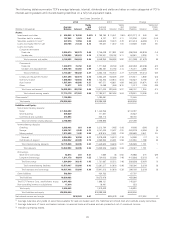
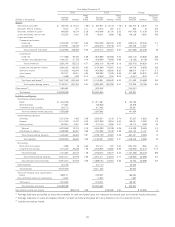
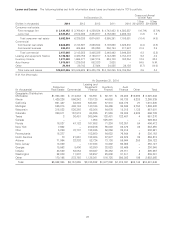
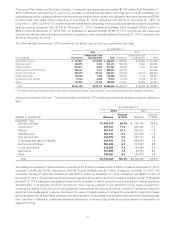
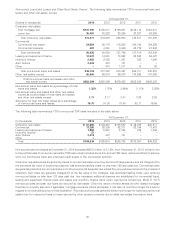
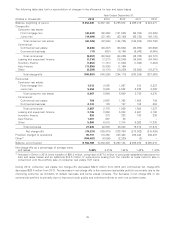
Loans and Leases The following tables set forth information about loans and leases held in TCF’s portfolio.
Compound Annual
At December 31, Growth Rate
1-Year 5-Year
(Dollars in thousands) 2014 2013 2012 2011 2010 2014/2013 2014/2009
Consumer real estate:
First mortgage lien $ 3,139,152 $ 3,766,421 $ 4,239,524 $ 4,742,423 $ 4,893,887 (16.7)% (8.7)%
Junior lien 2,543,212 2,572,905 2,434,977 2,152,868 2,262,194 (1.2) 1.9
Total consumer real estate 5,682,364 6,339,326 6,674,501 6,895,291 7,156,081 (10.4) (4.8)
Commercial:
Commercial real estate 2,624,255 2,743,697 3,080,942 3,198,698 3,328,216 (4.4) (4.3)
Commercial business 533,410 404,655 324,293 250,794 317,987 31.8 3.5
Total commercial 3,157,665 3,148,352 3,405,235 3,449,492 3,646,203 0.3 (3.2)
Leasing and equipment finance 3,745,322 3,428,755 3,198,017 3,142,259 3,154,478 9.2 4.0
Inventory finance 1,877,090 1,664,377 1,567,214 624,700 792,354 12.8 32.0
Auto finance 1,915,061 1,239,386 552,833 3,628 – 54.5 N.M.
Other 24,144 26,743 27,924 34,885 39,188 (9.7) (14.0)
Total loans and leases $16,401,646 $15,846,939 $15,425,724 $14,150,255 $14,788,304 3.5 2.4
N.M. Not Meaningful.
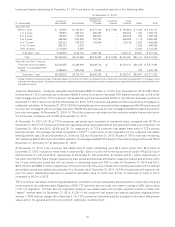
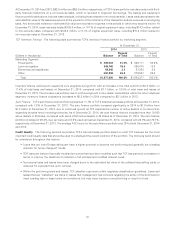
At December 31, 2014
Leasing and
Consumer Equipment Inventory Auto
(In thousands) Real Estate Commercial Finance Finance Finance Other Total
Geographic Distribution:
Minnesota $1,903,494 $ 814,248 $ 98,591 $ 62,701 $ 36,238 $10,060 $ 2,925,332
Illinois 1,429,226 566,342 130,125 44,688 90,138 5,320 2,265,839
California 651,447 33,304 523,361 57,918 344,778 27 1,610,835
Michigan 556,214 493,184 140,164 64,465 36,643 2,750 1,293,420
Wisconsin 315,832 535,355 62,004 54,676 18,012 1,122 987,001
Colorado 399,811 167,813 64,395 21,538 38,803 4,369 696,729
Texas 3 30,451 365,944 132,481 122,487 4 651,370
Canada – – 1,053 525,891 – – 526,944
Florida 16,827 47,182 167,658 71,334 103,357 54 406,412
New York 7,662 – 200,206 55,080 80,473 34 343,455
Ohio 5,239 70,707 133,495 52,066 39,414 – 300,921
Pennsylvania 15,377 – 153,500 54,632 76,644 9 300,162
North Carolina 70 21,661 133,804 37,977 65,674 33 259,219
Arizona 71,064 32,302 82,724 13,138 59,644 250 259,122
New Jersey 18,020 – 147,043 18,202 66,862 – 250,127
Georgia 15,563 8,400 93,890 32,523 80,469 – 230,845
Indiana 23,520 52,054 69,027 35,453 25,911 2 205,967
Washington 82,800 11,907 53,257 25,602 31,511 4 205,081
Other 170,195 272,755 1,125,081 516,725 598,003 106 2,682,865
Total $5,682,364 $3,157,665 $3,745,322 $1,877,090 $1,915,061 $24,144 $16,401,646
29