Singapore Airlines 2011 Annual Report Download - page 98
Download and view the complete annual report
Please find page 98 of the 2011 Singapore Airlines annual report below. You can navigate through the pages in the report by either clicking on the pages listed below, or by using the keyword search tool below to find specific information within the annual report.-
 1
1 -
2
-
3
-
4
-
5
-
6
-
7
-
8
-
9
-
10
-
11
-
12
-
13
-
14
-
15
-
16
-
17
-
18
-
19
-
20
-
21
-
22
-
23
-
24
-
25
-
26
-
27
-
28
-
29
-
30
-
31
-
32
-
33
-
34
-
35
-
36
-
37
-
38
-
39
-
40
-
41
-
42
-
43
-
44
-
45
-
46
-
47
-
48
-
49
-
50
-
51
-
52
-
53
-
54
-
55
-
56
-
57
-
58
-
59
-
60
-
61
-
62
-
63
-
64
-
65
-
66
-
67
-
68
-
69
-
70
-
71
-
72
-
73
-
74
-
75
-
76
-
77
-
78
-
79
-
80
-
81
-
82
-
83
-
84
-
85
-
86
-
87
-
 88
88 -
 89
89 -
 90
90 -
 91
91 -
 92
92 -
 93
93 -
 94
94 -
 95
95 -
 96
96 -
 97
97 -
 98
98 -
 99
99 -
 100
100 -
 101
101 -
 102
102 -
 103
103 -
 104
104 -
 105
105 -
 106
106 -
 107
107 -
 108
108 -
109
-
110
-
111
-
112
-
113
-
114
-
115
-
116
-
117
-
118
-
119
-
120
-
121
-
122
-
123
-
124
-
125
-
126
-
127
-
128
-
129
-
130
-
131
-
132
-
133
-
134
-
135
-
136
-
137
-
138
-
139
-
140
-
141
-
142
-
143
-
144
-
145
-
146
-
147
-
148
-
149
-
150
-
151
-
152
-
153
-
154
-
155
-
156
-
157
-
158
-
159
-
160
-
161
-
162
-
163
-
164
-
165
-
166
-
167
-
168
-
169
-
170
-
171
-
172
-
173
-
174
-
175
-
176
-
177
-
178
-
179
-
180
-
181
-
182
-
183
-
184
-
185
-
186
-
187
-
188
-
189
-
190
-
191
-
192
-
193
-
194
-
195
-
196
-
197
-
198
-
199
-
200
-
201
-
202
-
203
-
204
-
205
-
206
-
207
-
208
 |
 |

SINGAPORE AIRLINES
096
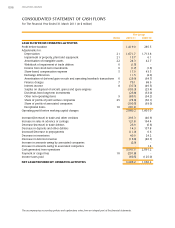
The Group
Notes 2010-11 2009-10
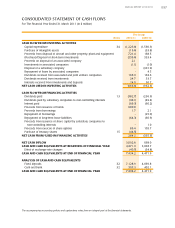
CASH FLOW FROM OPERATING ACTIVITIES
Profit before taxation 1,419.0 285.5
Adjustments for:
Depreciation 21 1,671.7 1,713.8
Impairment of property, plant and equipment 21 15.7 6.1
Amortisation of intangible assets 22 24.3 42.7
Writeback of impairment of trade debtors 6 (1.5) -
Income from short-term investments 6 (1.7) (1.6)
Share-based compensation expense 5 17.9 43.5
Exchange differences 11.5 (2.0)
Amortisation of deferred gain on sale and operating leaseback transactions 6 (29.0) (64.7)
Finance charges 7 70.1 68.9
Interest income 8 (37.3) (49.5)
Surplus on disposal of aircraft, spares and spare engines (103.3) (25.4)
Dividends from long-term investments (23.8) (33.0)
Other non-operating items 9 (80.1) (34.2)
Share of profits of joint venture companies 25 (74.6) (56.1)
Share of profits of associated companies (100.5) (93.0)
Exceptional items 10 201.8 -
Operating profit before working capital changes 2,980.2 1,801.0
Increase/(Decrease) in trade and other creditors 395.3 (40.9)
Increase in sales in advance of carriage 121.8 194.4
Decrease/(Increase) in trade debtors 23.9 (6.6)
Decrease in deposits and other debtors 14.3 157.8
(Increase)/Decrease in prepayments (11.0) 0.6
Decrease in inventories 40.0 24.2
Decrease in deferred revenue (15.0) (40.7)
Increase in amounts owing by associated companies (2.0) -
Increase in amounts owing to associated companies - 1.4
Cash generated from operations 3,547.5 2,091.2
Payment of cargo fines 10 (201.8) -
Income taxes paid (60.5) (125.0)
NET CASH PROVIDED BY OPERATING ACTIVITIES 3,285.2 1,966.2
CONSOLIDATED STATEMENT OF CASH FLOWS
For The Financial Year Ended 31 March 2011 (in $ million)
The accompanying accounting policies and explanatory notes form an integral part of the financial statements.