Singapore Airlines 2011 Annual Report Download - page 75
Download and view the complete annual report
Please find page 75 of the 2011 Singapore Airlines annual report below. You can navigate through the pages in the report by either clicking on the pages listed below, or by using the keyword search tool below to find specific information within the annual report.-
 1
1 -
2
-
3
-
4
-
5
-
6
-
7
-
8
-
9
-
10
-
11
-
12
-
13
-
14
-
15
-
16
-
17
-
18
-
19
-
20
-
21
-
22
-
23
-
24
-
25
-
26
-
27
-
28
-
29
-
30
-
31
-
32
-
33
-
34
-
35
-
36
-
37
-
38
-
39
-
40
-
41
-
42
-
43
-
44
-
45
-
46
-
47
-
48
-
49
-
50
-
51
-
52
-
53
-
54
-
55
-
56
-
57
-
58
-
59
-
60
-
61
-
62
-
63
-
64
-
 65
65 -
 66
66 -
 67
67 -
 68
68 -
 69
69 -
 70
70 -
 71
71 -
 72
72 -
 73
73 -
 74
74 -
 75
75 -
 76
76 -
 77
77 -
 78
78 -
 79
79 -
 80
80 -
 81
81 -
 82
82 -
 83
83 -
 84
84 -
 85
85 -
86
-
87
-
88
-
89
-
90
-
91
-
92
-
93
-
94
-
95
-
96
-
97
-
98
-
99
-
100
-
101
-
102
-
103
-
104
-
105
-
106
-
107
-
108
-
109
-
110
-
111
-
112
-
113
-
114
-
115
-
116
-
117
-
118
-
119
-
120
-
121
-
122
-
123
-
124
-
125
-
126
-
127
-
128
-
129
-
130
-
131
-
132
-
133
-
134
-
135
-
136
-
137
-
138
-
139
-
140
-
141
-
142
-
143
-
144
-
145
-
146
-
147
-
148
-
149
-
150
-
151
-
152
-
153
-
154
-
155
-
156
-
157
-
158
-
159
-
160
-
161
-
162
-
163
-
164
-
165
-
166
-
167
-
168
-
169
-
170
-
171
-
172
-
173
-
174
-
175
-
176
-
177
-
178
-
179
-
180
-
181
-
182
-
183
-
184
-
185
-
186
-
187
-
188
-
189
-
190
-
191
-
192
-
193
-
194
-
195
-
196
-
197
-
198
-
199
-
200
-
201
-
202
-
203
-
204
-
205
-
206
-
207
-
208
 |
 |

ANNUAL REPORT 2010/2011 073
FINANCIAL REVIEW
Performance of the Company (continued)
Surplus on Disposal of Aircraft, Spares and Spare Engines
The surplus on disposal of aircraft, spares and spare engines comprised mainly the sale of four B777-200
aircraft and the sale and leaseback of one A380-800 aircraft. In contrast, the Company made a gain of
$25 million on the sale of one B777-200 aircraft last year.
Taxation
There was a net tax expense of $183 million, comprising current tax charge of $319 million and deferred tax
credit of $136 million.
As at 31 March 2011, the Company’s deferred taxation account stood at $1,814 million.
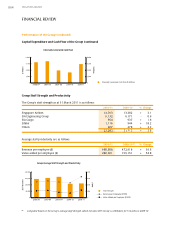
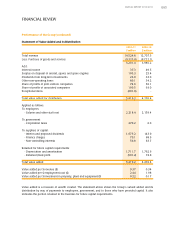
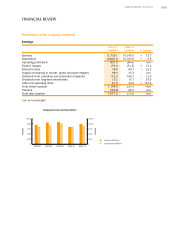
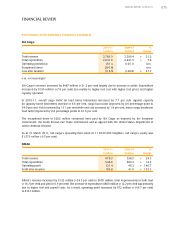
Staff Strength and Productivity
The Company’s staff strength as at 31 March 2011 was 13,793, an increase of 411 over last year.
The distribution of employee strength by category and location is as follows:
2010-11 2009-10 % Change
Category
Senior staff (administrative and higher ranking officers) 1,251 1,222 + 2.4
Technical crew 2,331 2,306 + 1.1
Cabin crew 7,304 6,787 + 7.6
Other ground staff 2,907 3,067 - 5.2
13,793 13,382 + 3.1
Location
Singapore 11,864 11,446 + 3.7
East Asia 778 780 - 0.3
Europe 398 398 -
South West Pacific 311 319 - 2.5
West Asia and Africa 269 270 - 0.4
Americas 173 169 + 2.4
13,793 13,382 + 3.1
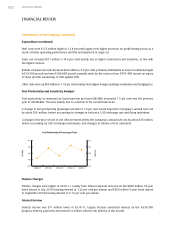
The Company’s average staff productivity ratiosR12 are shown below:
2010-11 2009-10 % Change
Seat capacity per employee (seat-km) 7,952,620 7,583,874 + 4.9
Passenger load carried per employee (tonne-km) 588,714 563,318 + 4.5
Revenue per employee ($) 863,931 728,075 + 18.7
Value added per employee ($) 310,480 219,678 + 41.3
R12 The Company’s staff productivity ratios were computed based on average staff strength of 13,588 in 2010-11 (2009-10: 13,934).