Singapore Airlines 2011 Annual Report Download - page 77
Download and view the complete annual report
Please find page 77 of the 2011 Singapore Airlines annual report below. You can navigate through the pages in the report by either clicking on the pages listed below, or by using the keyword search tool below to find specific information within the annual report.-
 1
1 -
2
-
3
-
4
-
5
-
6
-
7
-
8
-
9
-
10
-
11
-
12
-
13
-
14
-
15
-
16
-
17
-
18
-
19
-
20
-
21
-
22
-
23
-
24
-
25
-
26
-
27
-
28
-
29
-
30
-
31
-
32
-
33
-
34
-
35
-
36
-
37
-
38
-
39
-
40
-
41
-
42
-
43
-
44
-
45
-
46
-
47
-
48
-
49
-
50
-
51
-
52
-
53
-
54
-
55
-
56
-
57
-
58
-
59
-
60
-
61
-
62
-
63
-
64
-
65
-
66
-
 67
67 -
 68
68 -
 69
69 -
 70
70 -
 71
71 -
 72
72 -
 73
73 -
 74
74 -
 75
75 -
 76
76 -
 77
77 -
 78
78 -
 79
79 -
 80
80 -
 81
81 -
 82
82 -
 83
83 -
 84
84 -
 85
85 -
 86
86 -
 87
87 -
88
-
89
-
90
-
91
-
92
-
93
-
94
-
95
-
96
-
97
-
98
-
99
-
100
-
101
-
102
-
103
-
104
-
105
-
106
-
107
-
108
-
109
-
110
-
111
-
112
-
113
-
114
-
115
-
116
-
117
-
118
-
119
-
120
-
121
-
122
-
123
-
124
-
125
-
126
-
127
-
128
-
129
-
130
-
131
-
132
-
133
-
134
-
135
-
136
-
137
-
138
-
139
-
140
-
141
-
142
-
143
-
144
-
145
-
146
-
147
-
148
-
149
-
150
-
151
-
152
-
153
-
154
-
155
-
156
-
157
-
158
-
159
-
160
-
161
-
162
-
163
-
164
-
165
-
166
-
167
-
168
-
169
-
170
-
171
-
172
-
173
-
174
-
175
-
176
-
177
-
178
-
179
-
180
-
181
-
182
-
183
-
184
-
185
-
186
-
187
-
188
-
189
-
190
-
191
-
192
-
193
-
194
-
195
-
196
-
197
-
198
-
199
-
200
-
201
-
202
-
203
-
204
-
205
-
206
-
207
-
208
 |
 |

ANNUAL REPORT 2010/2011 075
FINANCIAL REVIEW
Performance of the Subsidiary Companies (continued)
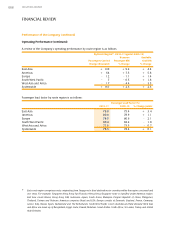
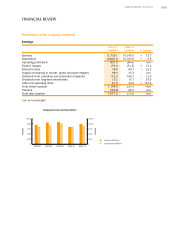
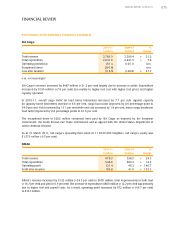
SIA Cargo
2010-11 2009-10 %
$ million $ million Change
Total revenue 2,783.3 2,296.4 + 21.2
Total expenditure 2,631.9 2,441.5 + 7.8
Operating profit/(loss) 151.4 (145.1) n.m.
Exceptional items (201.8) - n.m.
Loss after taxation (116.5) (148.8) + 21.7
n.m. not meaningful
SIA Cargo’s revenue increased by $487 million (+21.2 per cent) largely due to increase in yields. Expenditure
increased by $190 million (+7.8 per cent) due mainly to higher fuel cost with higher fuel prices and higher
capacity operated.
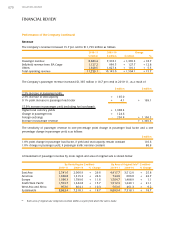
In 2010-11, overall cargo traffic (in load tonne kilometers) increased by 7.7 per cent. Against capacity
(in capacity tonne kilometers) increase of 6.6 per cent, cargo load factor improved by 0.6 percentage point to
64.0 per cent. Yield increased by 13.1 per cent while unit cost increased by 1.8 per cent, hence cargo breakeven
load factor improved by 6.8 percentage points to 61.6 per cent.
The exceptional items of $202 million comprised fines paid by SIA Cargo as imposed by the European
Commission, the South Korean Fair Trade Commission and as agreed with the United States Department of
Justice Antitrust Division.
As at 31 March 2011, SIA Cargo’s operating fleet stood at 11 B747-400 freighters. SIA Cargo’s equity was
$1,573 million (-6.5 per cent).
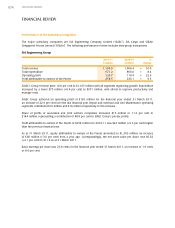
SilkAir
2010-11 2009-10 %
$ million $ million Change
Total revenue 670.3 538.5 + 24.5
Total expenditure 548.9 489.3 + 12.2
Operating profit 121.4 49.2 + 146.7
Profit after taxation 103.8 41.0 + 153.2
SilkAir’s revenue increased by $132 million (+24.5 per cent) to $670 million, from improvements in both load
(+16.7 per cent) and yield (+6.9 per cent). The increase in expenditure of $60 million (+12.2 per cent) was primarily
due to higher fuel and payroll costs. As a result, operating profit increased by $72 million (+146.7 per cent)
to $121 million.