Singapore Airlines 2011 Annual Report Download - page 76
Download and view the complete annual report
Please find page 76 of the 2011 Singapore Airlines annual report below. You can navigate through the pages in the report by either clicking on the pages listed below, or by using the keyword search tool below to find specific information within the annual report.-
 1
1 -
2
-
3
-
4
-
5
-
6
-
7
-
8
-
9
-
10
-
11
-
12
-
13
-
14
-
15
-
16
-
17
-
18
-
19
-
20
-
21
-
22
-
23
-
24
-
25
-
26
-
27
-
28
-
29
-
30
-
31
-
32
-
33
-
34
-
35
-
36
-
37
-
38
-
39
-
40
-
41
-
42
-
43
-
44
-
45
-
46
-
47
-
48
-
49
-
50
-
51
-
52
-
53
-
54
-
55
-
56
-
57
-
58
-
59
-
60
-
61
-
62
-
63
-
64
-
65
-
 66
66 -
 67
67 -
 68
68 -
 69
69 -
 70
70 -
 71
71 -
 72
72 -
 73
73 -
 74
74 -
 75
75 -
 76
76 -
 77
77 -
 78
78 -
 79
79 -
 80
80 -
 81
81 -
 82
82 -
 83
83 -
 84
84 -
 85
85 -
 86
86 -
87
-
88
-
89
-
90
-
91
-
92
-
93
-
94
-
95
-
96
-
97
-
98
-
99
-
100
-
101
-
102
-
103
-
104
-
105
-
106
-
107
-
108
-
109
-
110
-
111
-
112
-
113
-
114
-
115
-
116
-
117
-
118
-
119
-
120
-
121
-
122
-
123
-
124
-
125
-
126
-
127
-
128
-
129
-
130
-
131
-
132
-
133
-
134
-
135
-
136
-
137
-
138
-
139
-
140
-
141
-
142
-
143
-
144
-
145
-
146
-
147
-
148
-
149
-
150
-
151
-
152
-
153
-
154
-
155
-
156
-
157
-
158
-
159
-
160
-
161
-
162
-
163
-
164
-
165
-
166
-
167
-
168
-
169
-
170
-
171
-
172
-
173
-
174
-
175
-
176
-
177
-
178
-
179
-
180
-
181
-
182
-
183
-
184
-
185
-
186
-
187
-
188
-
189
-
190
-
191
-
192
-
193
-
194
-
195
-
196
-
197
-
198
-
199
-
200
-
201
-
202
-
203
-
204
-
205
-
206
-
207
-
208
 |
 |

SINGAPORE AIRLINES
074
FINANCIAL REVIEW
Performance of the Subsidiary Companies
The major subsidiary companies are SIA Engineering Company Limited (“SIAEC”), SIA Cargo and SilkAir
(Singapore) Private Limited (“SilkAir”). The following performance review includes intra-group transactions.
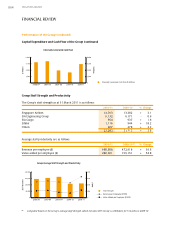
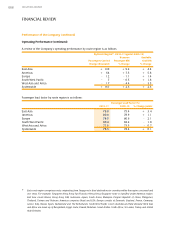
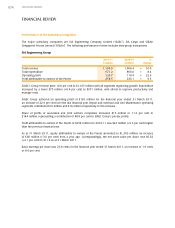
SIA Engineering Group
2010-11 2009-10 %
$ million $ million Change
Total revenue 1,106.9 1,006.4 + 10.0
Total expenditure 971.2 896.0 + 8.4
Operating profit 135.7 110.4 + 22.9
Profit attributable to owners of the Parent 258.5 236.1 + 9.5
SIAEC’s Group revenue grew 10.0 per cent to $1,107 million with all segments registering growth. Expenditure
increased by a lower $75 million (+8.4 per cent) to $971 million, with efforts to improve productivity and
manage costs.
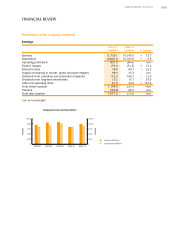
SIAEC Group achieved an operating profit of $136 million for the financial year ended 31 March 2011,
an increase of 22.9 per cent over the last financial year. Repair and overhaul and Line Maintenance operating
segments contributed $10 million and $16 million respectively to this increase.
Share of profits of associated and joint venture companies increased $15 million or 11.3 per cent to
$144 million, representing a contribution of 48.8 per cent to SIAEC Group’s pre-tax profits.
Profit attributable to owners of the Parent of $258 million for 2010-11 was $22 million (+9.5 per cent) higher
than the previous financial year.
As at 31 March 2011, equity attributable to owners of the Parent amounted to $1,303 million, an increase
of $38 million (+3.0 per cent) from a year ago. Correspondingly, the net asset value per share rose $0.02
(+2.1 per cent) to $1.19 as at 31 March 2011.
Basic earnings per share was 23.8 cents for the financial year ended 31 March 2011, an increase of 1.9 cents
or 8.6 per cent.