Singapore Airlines 2011 Annual Report Download - page 74
Download and view the complete annual report
Please find page 74 of the 2011 Singapore Airlines annual report below. You can navigate through the pages in the report by either clicking on the pages listed below, or by using the keyword search tool below to find specific information within the annual report.-
 1
1 -
2
-
3
-
4
-
5
-
6
-
7
-
8
-
9
-
10
-
11
-
12
-
13
-
14
-
15
-
16
-
17
-
18
-
19
-
20
-
21
-
22
-
23
-
24
-
25
-
26
-
27
-
28
-
29
-
30
-
31
-
32
-
33
-
34
-
35
-
36
-
37
-
38
-
39
-
40
-
41
-
42
-
43
-
44
-
45
-
46
-
47
-
48
-
49
-
50
-
51
-
52
-
53
-
54
-
55
-
56
-
57
-
58
-
59
-
60
-
61
-
62
-
63
-
 64
64 -
 65
65 -
 66
66 -
 67
67 -
 68
68 -
 69
69 -
 70
70 -
 71
71 -
 72
72 -
 73
73 -
 74
74 -
 75
75 -
 76
76 -
 77
77 -
 78
78 -
 79
79 -
 80
80 -
 81
81 -
 82
82 -
 83
83 -
 84
84 -
85
-
86
-
87
-
88
-
89
-
90
-
91
-
92
-
93
-
94
-
95
-
96
-
97
-
98
-
99
-
100
-
101
-
102
-
103
-
104
-
105
-
106
-
107
-
108
-
109
-
110
-
111
-
112
-
113
-
114
-
115
-
116
-
117
-
118
-
119
-
120
-
121
-
122
-
123
-
124
-
125
-
126
-
127
-
128
-
129
-
130
-
131
-
132
-
133
-
134
-
135
-
136
-
137
-
138
-
139
-
140
-
141
-
142
-
143
-
144
-
145
-
146
-
147
-
148
-
149
-
150
-
151
-
152
-
153
-
154
-
155
-
156
-
157
-
158
-
159
-
160
-
161
-
162
-
163
-
164
-
165
-
166
-
167
-
168
-
169
-
170
-
171
-
172
-
173
-
174
-
175
-
176
-
177
-
178
-
179
-
180
-
181
-
182
-
183
-
184
-
185
-
186
-
187
-
188
-
189
-
190
-
191
-
192
-
193
-
194
-
195
-
196
-
197
-
198
-
199
-
200
-
201
-
202
-
203
-
204
-
205
-
206
-
207
-
208
 |
 |

SINGAPORE AIRLINES
072
FINANCIAL REVIEW
Performance of the Company (continued)
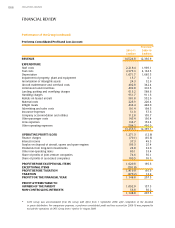
Expenditure (continued)
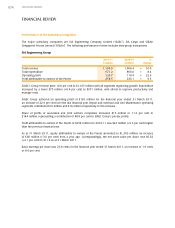
Staff costs were $175 million higher (+12.8 percent) largely from higher provision for profit-sharing bonus as a
result of better operating performance and the reinstatement of wage cut.
Sales cost increased $71 million (+14.6 per cent) mainly due to higher commission and incentives, in line with
the higher revenue.
Rentals on leased aircraft increased $44 million (+9.2 per cent), primarily attributable to lease of additional eight
A330-300 aircraft and one A380-800 aircraft, partially offset by the return of four B747-400 aircraft on expiry
of lease and the weakening of USD against SGD.
Other costs were up $60 million (+11.8 per cent), mainly from higher foreign exchange revaluation and hedging loss.
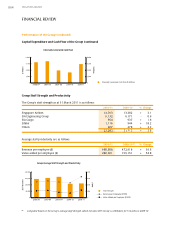
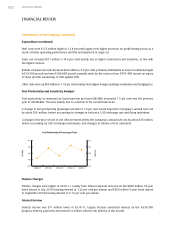
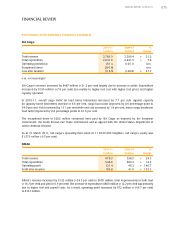
Fuel Productivity and Sensitivity Analysis
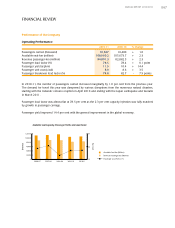
Fuel productivity as measured by load tonne-km per barrel (ltk/BBL) decreased 1.5 per cent over the previous
year to 425ltk/BBL. This was mainly due to a decline in the overall load factor.
A change in fuel productivity (passenger aircraft) of 1.0 per cent would impact the Company’s annual fuel cost
by about $36 million, before accounting for changes in fuel price, USD exchange rate and flying operations.
A change in the price of fuel of one USD per barrel affects the Company’s annual fuel cost by about $36 million,
before accounting for USD exchange movements, and changes in volume of fuel consumed.
Finance Charges
Finance charges were higher in 2010-11, mainly from interest expense incurred for the $500 million 10-year
bond (issued in July 2010) bearing interest of 3.22 per cent per annum and $300 million 5-year bond (issued
in September 2010) bearing interest of 2.15 per cent per annum.
Interest Income
Interest income was $11 million lower in 2010-11, largely because amortised interest on the A330-300
progress delivery payments decreased $14 million with the full delivery of the aircraft.