Singapore Airlines 2011 Annual Report Download - page 147
Download and view the complete annual report
Please find page 147 of the 2011 Singapore Airlines annual report below. You can navigate through the pages in the report by either clicking on the pages listed below, or by using the keyword search tool below to find specific information within the annual report.-
 1
1 -
2
-
3
-
4
-
5
-
6
-
7
-
8
-
9
-
10
-
11
-
12
-
13
-
14
-
15
-
16
-
17
-
18
-
19
-
20
-
21
-
22
-
23
-
24
-
25
-
26
-
27
-
28
-
29
-
30
-
31
-
32
-
33
-
34
-
35
-
36
-
37
-
38
-
39
-
40
-
41
-
42
-
43
-
44
-
45
-
46
-
47
-
48
-
49
-
50
-
51
-
52
-
53
-
54
-
55
-
56
-
57
-
58
-
59
-
60
-
61
-
62
-
63
-
64
-
65
-
66
-
67
-
68
-
69
-
70
-
71
-
72
-
73
-
74
-
75
-
76
-
77
-
78
-
79
-
80
-
81
-
82
-
83
-
84
-
85
-
86
-
87
-
88
-
89
-
90
-
91
-
92
-
93
-
94
-
95
-
96
-
97
-
98
-
99
-
100
-
101
-
102
-
103
-
104
-
105
-
106
-
107
-
108
-
109
-
110
-
111
-
112
-
113
-
114
-
115
-
116
-
117
-
118
-
119
-
120
-
121
-
122
-
123
-
124
-
125
-
126
-
127
-
128
-
129
-
130
-
131
-
132
-
133
-
134
-
135
-
136
-
 137
137 -
 138
138 -
 139
139 -
 140
140 -
 141
141 -
 142
142 -
 143
143 -
 144
144 -
 145
145 -
 146
146 -
 147
147 -
 148
148 -
 149
149 -
 150
150 -
 151
151 -
 152
152 -
 153
153 -
 154
154 -
 155
155 -
 156
156 -
 157
157 -
158
-
159
-
160
-
161
-
162
-
163
-
164
-
165
-
166
-
167
-
168
-
169
-
170
-
171
-
172
-
173
-
174
-
175
-
176
-
177
-
178
-
179
-
180
-
181
-
182
-
183
-
184
-
185
-
186
-
187
-
188
-
189
-
190
-
191
-
192
-
193
-
194
-
195
-
196
-
197
-
198
-
199
-
200
-
201
-
202
-
203
-
204
-
205
-
206
-
207
-
208
 |
 |

ANNUAL REPORT 2010/2011 145
NOTES TO THE FINANCIAL STATEMENTS
31 March 2011
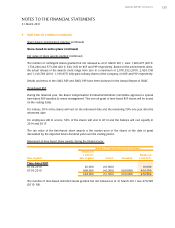
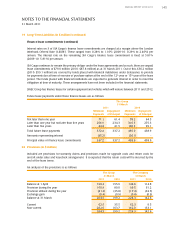
19 Long-Term Liabilities (in $ million) (continued)
Finance lease commitments (continued)
Interest rates on 3 of SIA Cargo’s finance lease commitments are charged at a margin above the London
Interbank Offered Rate (“LIBOR”). These ranged from 0.28% to 1.16% (2009-10: 0.29% to 2.46%) per
annum. The interest rate on the remaining SIA Cargo’s finance lease commitment is fixed at 5.81%
(2009-10: 5.81%) per annum.
SIA Cargo continues to remain the primary obligor under the lease agreements and as such, there are unpaid
lease commitments of $79.0 million (2010: $87.8 million) as at 31 March 2011. Out of this, $56.2 million
(2010: $59.1 million) are covered by funds placed with financial institutions under defeasance to provide
for payments due at time of exercise of purchase option at the end of the 12th year or 15th year of the lease
period. The funds placed with financial institutions are expected to generate interest in order to meet the
obligation at time of maturity. These arrangements have not been included in the financial statements.
SIAEC Group has finance leases for certain equipment and vehicles which will mature between 2011 and 2012.
Future lease payments under these finance leases are as follows:
The Group
31 March
2011 2010
Minimum Repayment Minimum Repayment
Payments of Principal Payments of Principal
Not later than one year 71.1 61.4 78.2 64.5
Later than one year but not later than five years 256.9 234.3 310.5 275.3
Later than five years 44.4 41.5 106.3 99.1
Total future lease payments 372.4 337.2 495.0 438.9
Amounts representing interest (35.2) - (56.1) -
Principal value of finance lease commitments 337.2 337.2 438.9 438.9
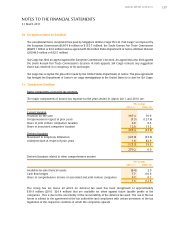
20 Provisions (in $ million)
Included are provisions for warranty claims and provisions made for upgrade costs and return costs for
aircraft under sales and leaseback arrangement. It is expected that the return costs will be incurred by the
end of the lease terms.
An analysis of the provisions is as follows:
The Group The Company
31 March 31 March
2011 2010 2011 2010
Balance at 1 April 199.2 155.9 142.6 114.8
Provision during the year 106.9 80.0 99.5 61.2
Provision utilised during the year (41.2) (35.8) (17.4) (32.5)
Exchange gain (0.4) (0.9) (0.4) (0.9)
Balance at 31 March 264.5 199.2 224.3 142.6
Current 62.5 35.5 62.3 9.5
Non-current 202.0 163.7 162.0 133.1
264.5 199.2 224.3 142.6