Singapore Airlines 2011 Annual Report Download - page 69
Download and view the complete annual report
Please find page 69 of the 2011 Singapore Airlines annual report below. You can navigate through the pages in the report by either clicking on the pages listed below, or by using the keyword search tool below to find specific information within the annual report.-
 1
1 -
2
-
3
-
4
-
5
-
6
-
7
-
8
-
9
-
10
-
11
-
12
-
13
-
14
-
15
-
16
-
17
-
18
-
19
-
20
-
21
-
22
-
23
-
24
-
25
-
26
-
27
-
28
-
29
-
30
-
31
-
32
-
33
-
34
-
35
-
36
-
37
-
38
-
39
-
40
-
41
-
42
-
43
-
44
-
45
-
46
-
47
-
48
-
49
-
50
-
51
-
52
-
53
-
54
-
55
-
56
-
57
-
58
-
 59
59 -
 60
60 -
 61
61 -
 62
62 -
 63
63 -
 64
64 -
 65
65 -
 66
66 -
 67
67 -
 68
68 -
 69
69 -
 70
70 -
 71
71 -
 72
72 -
 73
73 -
 74
74 -
 75
75 -
 76
76 -
 77
77 -
 78
78 -
 79
79 -
80
-
81
-
82
-
83
-
84
-
85
-
86
-
87
-
88
-
89
-
90
-
91
-
92
-
93
-
94
-
95
-
96
-
97
-
98
-
99
-
100
-
101
-
102
-
103
-
104
-
105
-
106
-
107
-
108
-
109
-
110
-
111
-
112
-
113
-
114
-
115
-
116
-
117
-
118
-
119
-
120
-
121
-
122
-
123
-
124
-
125
-
126
-
127
-
128
-
129
-
130
-
131
-
132
-
133
-
134
-
135
-
136
-
137
-
138
-
139
-
140
-
141
-
142
-
143
-
144
-
145
-
146
-
147
-
148
-
149
-
150
-
151
-
152
-
153
-
154
-
155
-
156
-
157
-
158
-
159
-
160
-
161
-
162
-
163
-
164
-
165
-
166
-
167
-
168
-
169
-
170
-
171
-
172
-
173
-
174
-
175
-
176
-
177
-
178
-
179
-
180
-
181
-
182
-
183
-
184
-
185
-
186
-
187
-
188
-
189
-
190
-
191
-
192
-
193
-
194
-
195
-
196
-
197
-
198
-
199
-
200
-
201
-
202
-
203
-
204
-
205
-
206
-
207
-
208
 |
 |

ANNUAL REPORT 2010/2011 067
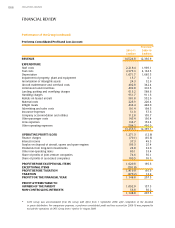
FINANCIAL REVIEW
Performance of the Company
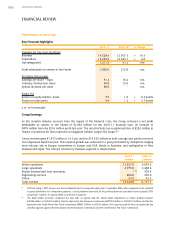
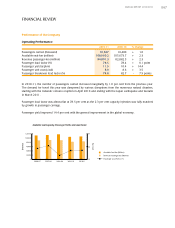
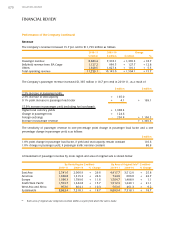
Operating Performance
2010-11 2009-10 % Change
Passengers carried (thousand) 16,647 16,480 + 1.0
Available seat-km (million) 108,060.2 105,673.7 + 2.3
Revenue passenger-km (million) 84,801.3 82,882.5 + 2.3
Passenger load factor (%) 78.5 78.4 + 0.1 point
Passenger yield (¢/pkm) 11.9 10.4 + 14.4
Passenger unit cost (¢/ask) 8.9 8.6 + 3.5
Passenger breakeven load factor (%) 74.8 82.7 - 7.9 points
In 2010-11, the number of passengers carried increased marginally by 1.0 per cent from the previous year.
The demand for travel this year was dampened by various disruptions from the numerous natural disasters,
starting with the Icelandic volcano eruption in April 2010 and ending with the Japan earthquake and tsunami
in March 2011.
Passenger load factor was almost flat at 78.5 per cent as the 2.3 per cent capacity injection was fully matched
by growth in passenger carriage.
Passenger yield improved 14.4 per cent with the general improvement in the global economy.
75
80
85