Singapore Airlines 2011 Annual Report Download - page 70
Download and view the complete annual report
Please find page 70 of the 2011 Singapore Airlines annual report below. You can navigate through the pages in the report by either clicking on the pages listed below, or by using the keyword search tool below to find specific information within the annual report.-
 1
1 -
 2
2 -
 3
3 -
 4
4 -
 5
5 -
 6
6 -
 7
7 -
 8
8 -
 9
9 -
 10
10 -
 11
11 -
 12
12 -
 13
13 -
 14
14 -
 15
15 -
 16
16 -
 17
17 -
 18
18 -
 19
19 -
 20
20 -
 21
21 -
 22
22 -
 23
23 -
 24
24 -
 25
25 -
 26
26 -
 27
27 -
 28
28 -
 29
29 -
 30
30 -
 31
31 -
 32
32 -
 33
33 -
 34
34 -
 35
35 -
 36
36 -
 37
37 -
 38
38 -
 39
39 -
 40
40 -
 41
41 -
 42
42 -
 43
43 -
 44
44 -
 45
45 -
 46
46 -
 47
47 -
 48
48 -
 49
49 -
 50
50 -
 51
51 -
 52
52 -
 53
53 -
 54
54 -
 55
55 -
 56
56 -
 57
57 -
 58
58 -
 59
59 -
 60
60 -
 61
61 -
 62
62 -
 63
63 -
 64
64 -
 65
65 -
 66
66 -
 67
67 -
 68
68 -
 69
69 -
 70
70 -
 71
71 -
 72
72 -
 73
73 -
 74
74 -
 75
75 -
 76
76 -
 77
77 -
 78
78 -
 79
79 -
 80
80 -
 81
81 -
 82
82 -
 83
83 -
 84
84 -
 85
85 -
 86
86 -
 87
87 -
 88
88 -
 89
89 -
 90
90 -
 91
91 -
 92
92 -
 93
93 -
 94
94 -
 95
95 -
 96
96 -
 97
97 -
 98
98 -
 99
99 -
 100
100 -
 101
101 -
 102
102 -
 103
103 -
 104
104 -
 105
105 -
 106
106 -
 107
107 -
 108
108 -
 109
109 -
 110
110 -
 111
111 -
 112
112 -
 113
113 -
 114
114 -
 115
115 -
 116
116 -
 117
117 -
 118
118 -
 119
119 -
 120
120 -
 121
121 -
 122
122 -
 123
123 -
 124
124 -
 125
125 -
 126
126 -
 127
127 -
 128
128 -
 129
129 -
 130
130 -
 131
131 -
 132
132 -
 133
133 -
 134
134 -
 135
135 -
 136
136 -
 137
137 -
 138
138 -
 139
139 -
 140
140 -
 141
141 -
 142
142 -
 143
143 -
 144
144 -
 145
145 -
 146
146 -
 147
147 -
 148
148 -
 149
149 -
 150
150 -
 151
151 -
 152
152 -
 153
153 -
 154
154 -
 155
155 -
 156
156 -
 157
157 -
 158
158 -
 159
159 -
 160
160 -
 161
161 -
 162
162 -
 163
163 -
 164
164 -
 165
165 -
 166
166 -
 167
167 -
 168
168 -
 169
169 -
 170
170 -
 171
171 -
 172
172 -
 173
173 -
 174
174 -
 175
175 -
 176
176 -
 177
177 -
 178
178 -
 179
179 -
 180
180 -
 181
181 -
 182
182 -
 183
183 -
 184
184 -
 185
185 -
 186
186 -
 187
187 -
 188
188 -
 189
189 -
 190
190 -
 191
191 -
 192
192 -
 193
193 -
 194
194 -
 195
195 -
 196
196 -
 197
197 -
 198
198 -
 199
199 -
 200
200 -
 201
201 -
 202
202 -
 203
203 -
 204
204 -
 205
205 -
 206
206 -
 207
207 -
 208
208
 |
 |

SINGAPORE AIRLINES
068
FINANCIAL REVIEW
Performance of the Company (continued)
Operating Performance (continued)
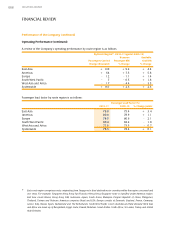
A review of the Company’s operating performance by route region is as follows:
By Route RegionR6 (2010-11 against 2009-10)
Revenue Available
Passengers Carried Passenger KM Seat KM
Change (thousand) % Change % Change
East Asia + 139 + 9.2 + 4.4
Americas + 64 + 7.3 + 5.8
Europe - 12 - 1.1 + 1.4
South West Pacific - 7 - 0.5 + 1.8
West Asia and Africa - 17 - 4.4 - 3.5
Systemwide + 167 + 2.3 + 2.3
Passenger load factor by route region is as follows:
Passenger Load Factor (%)
2010-11 2009-10 % Change points
East Asia 78.8 75.4 + 3.4
Americas 80.0 78.9 + 1.1
Europe 78.5 80.6 - 2.1
South West Pacific 80.4 82.2 - 1.8
West Asia and Africa 72.6 73.3 - 0.7
Systemwide 78.5 78.4 + 0.1
R6 Each route region comprises routes originating from Singapore to final destinations in countries within the region concerned and
vice versa. For example, Singapore-Hong Kong-San Francisco-Hong Kong-Singapore route is classified under Americas region.
East Asia covers Brunei, Hong Kong SAR, Indonesia, Japan, South Korea, Malaysia, People’s Republic of China, Philippines,
Thailand, Taiwan and Vietnam. Americas comprises Brazil and USA. Europe consists of Denmark, England, France, Germany,
Greece, Italy, Russia, Spain, Switzerland and The Netherlands. South West Pacific covers Australia and New Zealand. West Asia
and Africa are made up of Bangladesh, Egypt, India, Kuwait, Maldives, Saudi Arabia, South Africa, Sri Lanka, Turkey and United
Arab Emirates.
