Singapore Airlines 2011 Annual Report Download - page 194
Download and view the complete annual report
Please find page 194 of the 2011 Singapore Airlines annual report below. You can navigate through the pages in the report by either clicking on the pages listed below, or by using the keyword search tool below to find specific information within the annual report.-
 1
1 -
2
-
3
-
4
-
5
-
6
-
7
-
8
-
9
-
10
-
11
-
12
-
13
-
14
-
15
-
16
-
17
-
18
-
19
-
20
-
21
-
22
-
23
-
24
-
25
-
26
-
27
-
28
-
29
-
30
-
31
-
32
-
33
-
34
-
35
-
36
-
37
-
38
-
39
-
40
-
41
-
42
-
43
-
44
-
45
-
46
-
47
-
48
-
49
-
50
-
51
-
52
-
53
-
54
-
55
-
56
-
57
-
58
-
59
-
60
-
61
-
62
-
63
-
64
-
65
-
66
-
67
-
68
-
69
-
70
-
71
-
72
-
73
-
74
-
75
-
76
-
77
-
78
-
79
-
80
-
81
-
82
-
83
-
84
-
85
-
86
-
87
-
88
-
89
-
90
-
91
-
92
-
93
-
94
-
95
-
96
-
97
-
98
-
99
-
100
-
101
-
102
-
103
-
104
-
105
-
106
-
107
-
108
-
109
-
110
-
111
-
112
-
113
-
114
-
115
-
116
-
117
-
118
-
119
-
120
-
121
-
122
-
123
-
124
-
125
-
126
-
127
-
128
-
129
-
130
-
131
-
132
-
133
-
134
-
135
-
136
-
137
-
138
-
139
-
140
-
141
-
142
-
143
-
144
-
145
-
146
-
147
-
148
-
149
-
150
-
151
-
152
-
153
-
154
-
155
-
156
-
157
-
158
-
159
-
160
-
161
-
162
-
163
-
164
-
165
-
166
-
167
-
168
-
169
-
170
-
171
-
172
-
173
-
174
-
175
-
176
-
177
-
178
-
179
-
180
-
181
-
182
-
183
-
 184
184 -
 185
185 -
 186
186 -
 187
187 -
 188
188 -
 189
189 -
 190
190 -
 191
191 -
 192
192 -
 193
193 -
 194
194 -
 195
195 -
 196
196 -
 197
197 -
 198
198 -
 199
199 -
 200
200 -
 201
201 -
 202
202 -
 203
203 -
 204
204 -
205
-
206
-
207
-
208
 |
 |

SINGAPORE AIRLINES
192
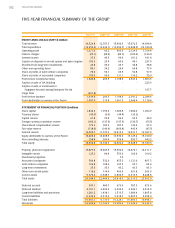
FIVE-YEAR FINANCIAL SUMMARY OF THE GROUP
2010-11 2009-10 2008-09 2007-08 2006-07
PROFIT AND LOSS ACCOUNT ($ million)
Total revenue 14,524.8 12,707.3 15,996.3 15,972.5 14,494.4
Total expenditure (13,253.5) (12,644.1) (15,092.7) (13,848.0) (13,180.0)
Operating profit 1,271.3 63.2 903.6 2,124.5 1,314.4
Finance charges (70.1) (68.9) (89.7) (100.2) (124.1)
Interest income 37.3 49.5 96.0 181.2 181.8
Surplus on disposal of aircraft, spares and spare engines 103.3 25.4 60.6 49.1 237.9
Dividend from long-term investments 23.8 33.0 23.7 34.8 38.8
Other non-operating items 80.1 34.2 29.4 96.8 77.9
Share of profits of joint venture companies 74.6 56.1 63.9 50.8 57.9
Share of profits of associated companies 100.5 93.0 111.1 110.2 79.0
Profit before exceptional items 1,620.8 285.5 1,198.6 2,547.2 1,863.6
Surplus on sale of SIA Building - - - - 223.3
Surplus on sale of investment in
Singapore Aircraft Leasing Enterprise Pte Ltd - - - - 197.7
Cargo fines (201.8) - - - -
Profit before taxation 1,419.0 285.5 1,198.6 2,547.2 2,284.6
Profit attributable to owners of the Parent 1,092.0 215.8 1,061.5 2,049.4 2,128.8
STATEMENT OF FINANCIAL POSITION ($ million)
Share capital 1,832.4 1,750.6 1,684.8 1,682.0 1,494.9
Treasury shares (43.0) (0.9) (44.4) (33.2) -
Capital reserve 91.8 74.8 86.3 95.6 44.9
Foreign currency translation reserve (186.1) (137.0) (137.9) (130.7) (59.5)
Share-based compensation reserve 172.6 185.3 187.3 136.4 97.3
Fair value reserve (138.0) (140.9) (660.8) 443.4 (45.5)
General reserve 12,474.7 11,737.0 12,815.3 12,931.7 13,567.9
Equity attributable to owners of the Parent 14,204.4 13,468.9 13,930.6 15,125.2 15,100.0
Non-controlling interests 298.4 280.4 559.8 503.7 443.3
Total equity 14,502.8 13,749.3 14,490.4 15,628.9 15,543.3
Property, plant and equipment 13,877.6 15,063.9 15,992.4 16,474.1 16,311.7
Intangible assets 125.2 80.8 553.0 106.6 100.2
Investment properties - - 7.0 - -
Associated companies 504.8 532.6 855.3 1,121.0 897.5
Joint venture companies 102.8 108.6 127.5 95.1 86.6
Long-term investments 35.3 35.3 43.2 43.3 43.3
Other non-current assets 119.6 114.4 403.6 361.8 303.9
Current assets 9,779.2 6,548.7 6,836.5 8,313.3 8,248.8
Total assets 24,544.5 22,484.3 24,818.5 26,515.2 25,992.0
Deferred account 347.1 480.7 673.9 787.3 973.6
Deferred taxation 2,181.1 2,296.6 2,222.0 2,542.1 2,410.9
Long-term liabilities and provisions 1,281.2 1,438.1 1,513.5 1,689.4 1,805.8
Current liabilities 6,232.3 4,519.6 5,918.7 5,867.5 5,258.4
Total liabilities 10,041.7 8,735.0 10,328.1 10,886.3 10,448.7
Net assets 14,502.8 13,749.3 14,490.4 15,628.9 15,543.3