Singapore Airlines 2011 Annual Report Download - page 182
Download and view the complete annual report
Please find page 182 of the 2011 Singapore Airlines annual report below. You can navigate through the pages in the report by either clicking on the pages listed below, or by using the keyword search tool below to find specific information within the annual report.
SINGAPORE AIRLINES
180
NOTES TO THE FINANCIAL STATEMENTS
31 March 2011
38 Financial Risk Management Objectives and Policies (in $ million) (continued)
(e) Liquidity risk
At 31 March 2011, the Group has at its disposal, cash and short-term deposits amounting to
$7,434.2 million (2010: $4,471.9 million). In addition, the Group has available short-term credit
facilities of about $521.0 million (2010: $535.1 million). The Group also has Medium Term Note
Programmes under which it may issue notes up to $1,000.0 million (2010: $1,000.0 million) and as
of 31 March 2011, $500.0 million remains unutilised. Under these Programmes, notes issued by the
Company may have varying maturities as agreed with the relevant financial institutions.
The Group’s holdings of cash and short-term deposits, together with committed funding facilities and
net cash flow from operations, are expected to be sufficient to cover the cost of all firm aircraft deliveries
due in the next financial year. It is expected that any shortfall would be met by bank borrowings or
public market funding. Due to the necessity to plan aircraft orders well in advance of delivery, it is not
economical for the Group to have committed funding in place at present for all outstanding orders,
many of which relate to aircraft which will not be delivered for several years. The Group’s policies in
this regard are in line with the funding policies of other major airlines.
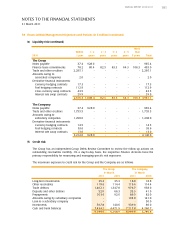
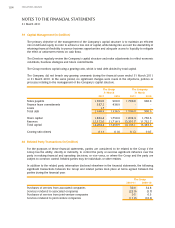
The maturity profile of the financial liabilities of the Group and the Company is as follows. The amounts
disclosed in the table are the contractual undiscounted cash flows. Balances due within 12 months
approximate their carrying amounts as the impact of discounting is insignificant.
More
Within 1 - 2 2 - 3 3 - 4 4 - 5 than
2011 1 year years years years years 5 years Total
The Group
Notes payable 949.4 22.6 22.6 22.6 319.3 568.7 1,905.2
Finance lease commitments 71.1 73.4 74.5 57.5 51.5 44.4 372.4
Trade and other creditors 2,725.7 - - - - - 2,725.7
Derivative financial instruments:
Currency hedging contracts 57.3 - - - - - 57.3
Cross currency swap contracts 63.3 - - - - - 63.3
Interest rate swap contracts 15.3 - - - - - 15.3
3,882.1 96.0 97.1 80.1 370.8 613.1 5,139.2
The Company
Notes payable 949.4 22.6 22.6 22.6 319.3 568.7 1,905.2
Trade and other creditors 2,161.8 - - - - - 2,161.8
Amounts owing to
subsidiary companies 1,529.0 - - - - - 1,529.0
Derivative financial instruments:
Currency hedging contracts 48.5 - - - - - 48.5
4,688.7 22.6 22.6 22.6 319.3 568.7 5,644.5


