Singapore Airlines 2011 Annual Report Download - page 164
Download and view the complete annual report
Please find page 164 of the 2011 Singapore Airlines annual report below. You can navigate through the pages in the report by either clicking on the pages listed below, or by using the keyword search tool below to find specific information within the annual report.-
 1
1 -
2
-
3
-
4
-
5
-
6
-
7
-
8
-
9
-
10
-
11
-
12
-
13
-
14
-
15
-
16
-
17
-
18
-
19
-
20
-
21
-
22
-
23
-
24
-
25
-
26
-
27
-
28
-
29
-
30
-
31
-
32
-
33
-
34
-
35
-
36
-
37
-
38
-
39
-
40
-
41
-
42
-
43
-
44
-
45
-
46
-
47
-
48
-
49
-
50
-
51
-
52
-
53
-
54
-
55
-
56
-
57
-
58
-
59
-
60
-
61
-
62
-
63
-
64
-
65
-
66
-
67
-
68
-
69
-
70
-
71
-
72
-
73
-
74
-
75
-
76
-
77
-
78
-
79
-
80
-
81
-
82
-
83
-
84
-
85
-
86
-
87
-
88
-
89
-
90
-
91
-
92
-
93
-
94
-
95
-
96
-
97
-
98
-
99
-
100
-
101
-
102
-
103
-
104
-
105
-
106
-
107
-
108
-
109
-
110
-
111
-
112
-
113
-
114
-
115
-
116
-
117
-
118
-
119
-
120
-
121
-
122
-
123
-
124
-
125
-
126
-
127
-
128
-
129
-
130
-
131
-
132
-
133
-
134
-
135
-
136
-
137
-
138
-
139
-
140
-
141
-
142
-
143
-
144
-
145
-
146
-
147
-
148
-
149
-
150
-
151
-
152
-
153
-
 154
154 -
 155
155 -
 156
156 -
 157
157 -
 158
158 -
 159
159 -
 160
160 -
 161
161 -
 162
162 -
 163
163 -
 164
164 -
 165
165 -
 166
166 -
 167
167 -
 168
168 -
 169
169 -
 170
170 -
 171
171 -
 172
172 -
 173
173 -
 174
174 -
175
-
176
-
177
-
178
-
179
-
180
-
181
-
182
-
183
-
184
-
185
-
186
-
187
-
188
-
189
-
190
-
191
-
192
-
193
-
194
-
195
-
196
-
197
-
198
-
199
-
200
-
201
-
202
-
203
-
204
-
205
-
206
-
207
-
208
 |
 |

SINGAPORE AIRLINES
162
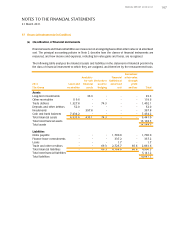
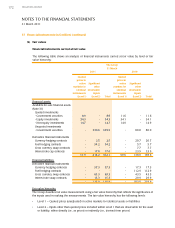
NOTES TO THE FINANCIAL STATEMENTS
31 March 2011
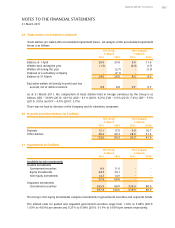
32 Cash and Bank Balances (in $ million)
The Group The Company
31 March 31 March
2011 2010 2011 2010
Fixed deposits 7,128.9 4,069.8 7,102.3 4,038.7
Cash and bank 305.3 402.1 115.5 222.0
7,434.2 4,471.9 7,217.8 4,260.7
As at 31 March 2011, the composition of cash and bank balances held in foreign currencies by the Group
is as follows: USD – 13.8% (2010: 11.0%), EUR – 1.1% (2010: 1.5%) and AUD – 1.1% (2010: 1.2%).
Cash at bank earns interest at floating rates based on daily bank deposit rates ranging from 0.01% to
4.87% (2009-10: 0.01% to 4.03%) per annum. Short-term deposits are made for varying periods of
between one day and one year depending on the immediate cash requirements of the Group, and earn
interest at the respective short-term deposit rates. The weighted average effective interest rate for short-
term deposits is 0.46% (2009-10: 0.35%) per annum.
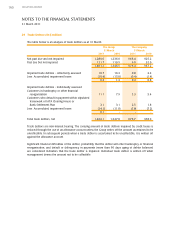
33 Trade and Other Creditors (in $ million)
Trade and other creditors are non-interest bearing. As at 31 March 2011, 9.7% (2010: 9.6%) of trade and
other creditors were held in USD by the Group.
34 Analysis of Capital Expenditure Cash Flow (in $ million)
The Group
2010-11 2009-10
Purchase of property, plant and equipment 1,234.4 1,575.7
Property, plant and equipment acquired under credit terms (10.6) (15.4)
Cash invested in capital expenditure 1,223.8 1,560.3
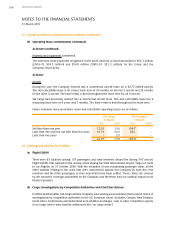
35 Capital and Other Commitments (in $ million)
(a) Capital expenditure commitments
The Group and the Company have commitments for capital expenditure. Such commitments
aggregated $6,556.6 million (2010: $7,581.7 million) for the Group and $6,015.7 million (2010:
$6,839.8 million) for the Company. The commitments relate principally to the acquisition of aircraft
fleet and related equipment.
In addition, the Group’s share of joint venture companies’ commitments for capital expenditures
totalled $1.0 million (2010: $2.4 million).