Singapore Airlines 2011 Annual Report Download - page 64
Download and view the complete annual report
Please find page 64 of the 2011 Singapore Airlines annual report below. You can navigate through the pages in the report by either clicking on the pages listed below, or by using the keyword search tool below to find specific information within the annual report.-
 1
1 -
2
-
3
-
4
-
5
-
6
-
7
-
8
-
9
-
10
-
11
-
12
-
13
-
14
-
15
-
16
-
17
-
18
-
19
-
20
-
21
-
22
-
23
-
24
-
25
-
26
-
27
-
28
-
29
-
30
-
31
-
32
-
33
-
34
-
35
-
36
-
37
-
38
-
39
-
40
-
41
-
42
-
43
-
44
-
45
-
46
-
47
-
48
-
49
-
50
-
51
-
52
-
53
-
 54
54 -
 55
55 -
 56
56 -
 57
57 -
 58
58 -
 59
59 -
 60
60 -
 61
61 -
 62
62 -
 63
63 -
 64
64 -
 65
65 -
 66
66 -
 67
67 -
 68
68 -
 69
69 -
 70
70 -
 71
71 -
 72
72 -
 73
73 -
 74
74 -
75
-
76
-
77
-
78
-
79
-
80
-
81
-
82
-
83
-
84
-
85
-
86
-
87
-
88
-
89
-
90
-
91
-
92
-
93
-
94
-
95
-
96
-
97
-
98
-
99
-
100
-
101
-
102
-
103
-
104
-
105
-
106
-
107
-
108
-
109
-
110
-
111
-
112
-
113
-
114
-
115
-
116
-
117
-
118
-
119
-
120
-
121
-
122
-
123
-
124
-
125
-
126
-
127
-
128
-
129
-
130
-
131
-
132
-
133
-
134
-
135
-
136
-
137
-
138
-
139
-
140
-
141
-
142
-
143
-
144
-
145
-
146
-
147
-
148
-
149
-
150
-
151
-
152
-
153
-
154
-
155
-
156
-
157
-
158
-
159
-
160
-
161
-
162
-
163
-
164
-
165
-
166
-
167
-
168
-
169
-
170
-
171
-
172
-
173
-
174
-
175
-
176
-
177
-
178
-
179
-
180
-
181
-
182
-
183
-
184
-
185
-
186
-
187
-
188
-
189
-
190
-
191
-
192
-
193
-
194
-
195
-
196
-
197
-
198
-
199
-
200
-
201
-
202
-
203
-
204
-
205
-
206
-
207
-
208
 |
 |
SINGAPORE AIRLINES
062
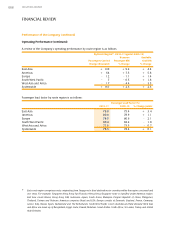
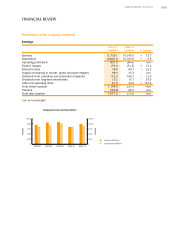
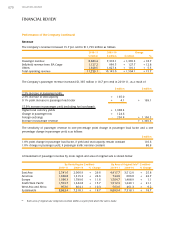
FINANCIAL REVIEW
Performance of the Group (continued)
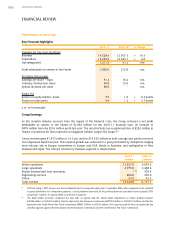
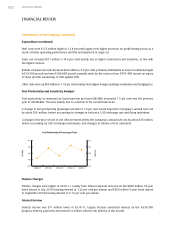
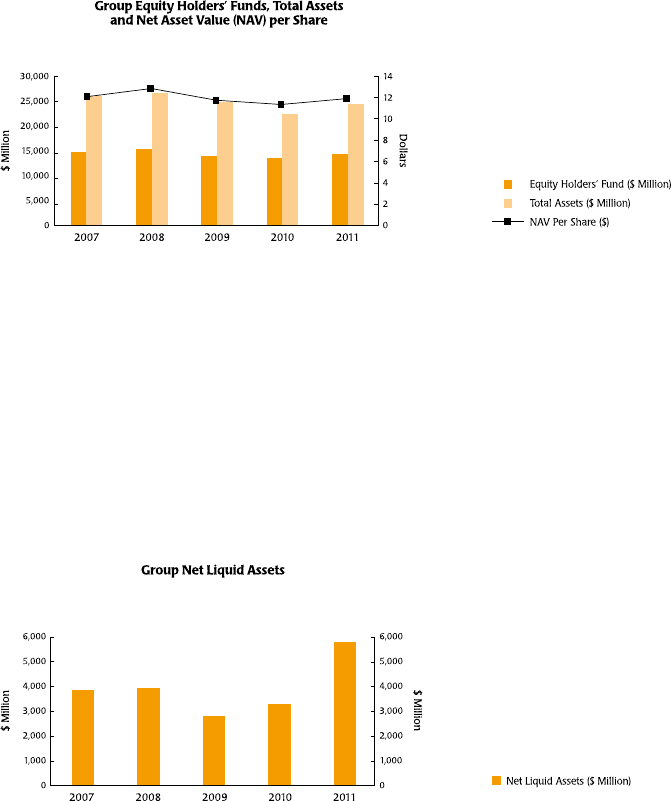
Financial Position
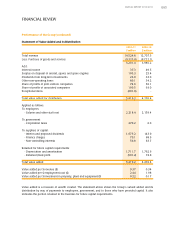
Equity attributable to owners of the Parent increased by $735 million or 5.5 per cent to $14,204 million as at
31 March 2011 due mainly to profit for the year (+$1,092 million), partially offset by payment of interim
dividend of 20 cents per share in respect of 2010-11 (-$239 million) and final dividend of 12 cents per share
in respect of 2009-10 (-$143 million).
Total Group assets increased by $2,060 million or 9.2 per cent to $24,544 million as at 31 March 2011 mainly
attributable to increase in cash and bank balances by $2,962 million, arising from operational cash inflows and
proceeds from bond issuance. Investments increased $257 million with purchase of Singapore Government
Treasury Bills. This was partially offset by the decrease in property, plant and equipment of $1,186 million,
mainly from depreciation charges for the financial year. Net asset value per share increased 5.2 per cent
to $11.89.
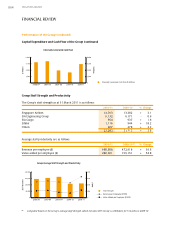
The Group’s net liquid assets R3 increased $2,519 million to $5,793 million as at 31 March 2011, mainly a result
of cash generated from operations. Total debt to equity ratio at 0.14 times increased 0.04 times.
R3 Net liquid assets is defined as the sum of cash and bank balances, investments, net of finance lease commitments, loans and
bonds issued.