Singapore Airlines 2011 Annual Report Download - page 68
Download and view the complete annual report
Please find page 68 of the 2011 Singapore Airlines annual report below. You can navigate through the pages in the report by either clicking on the pages listed below, or by using the keyword search tool below to find specific information within the annual report.-
 1
1 -
2
-
3
-
4
-
5
-
6
-
7
-
8
-
9
-
10
-
11
-
12
-
13
-
14
-
15
-
16
-
17
-
18
-
19
-
20
-
21
-
22
-
23
-
24
-
25
-
26
-
27
-
28
-
29
-
30
-
31
-
32
-
33
-
34
-
35
-
36
-
37
-
38
-
39
-
40
-
41
-
42
-
43
-
44
-
45
-
46
-
47
-
48
-
49
-
50
-
51
-
52
-
53
-
54
-
55
-
56
-
57
-
 58
58 -
 59
59 -
 60
60 -
 61
61 -
 62
62 -
 63
63 -
 64
64 -
 65
65 -
 66
66 -
 67
67 -
 68
68 -
 69
69 -
 70
70 -
 71
71 -
 72
72 -
 73
73 -
 74
74 -
 75
75 -
 76
76 -
 77
77 -
 78
78 -
79
-
80
-
81
-
82
-
83
-
84
-
85
-
86
-
87
-
88
-
89
-
90
-
91
-
92
-
93
-
94
-
95
-
96
-
97
-
98
-
99
-
100
-
101
-
102
-
103
-
104
-
105
-
106
-
107
-
108
-
109
-
110
-
111
-
112
-
113
-
114
-
115
-
116
-
117
-
118
-
119
-
120
-
121
-
122
-
123
-
124
-
125
-
126
-
127
-
128
-
129
-
130
-
131
-
132
-
133
-
134
-
135
-
136
-
137
-
138
-
139
-
140
-
141
-
142
-
143
-
144
-
145
-
146
-
147
-
148
-
149
-
150
-
151
-
152
-
153
-
154
-
155
-
156
-
157
-
158
-
159
-
160
-
161
-
162
-
163
-
164
-
165
-
166
-
167
-
168
-
169
-
170
-
171
-
172
-
173
-
174
-
175
-
176
-
177
-
178
-
179
-
180
-
181
-
182
-
183
-
184
-
185
-
186
-
187
-
188
-
189
-
190
-
191
-
192
-
193
-
194
-
195
-
196
-
197
-
198
-
199
-
200
-
201
-
202
-
203
-
204
-
205
-
206
-
207
-
208
 |
 |

SINGAPORE AIRLINES
066
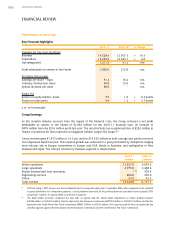
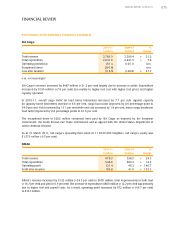
FINANCIAL REVIEW
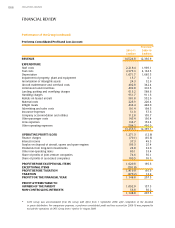
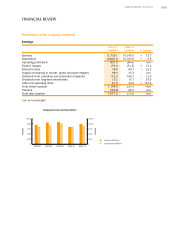
Performance of the Group (continued)
Proforma Consolidated Profit and Loss Account
Proforma R5
2010-11 2009-10
$ million $ million
REVENUE 14,524.8 12,336.9
EXPENDITURE
Staff costs 2,218.4 1,969.1
Fuel costs 4,575.3 4,194.5
Depreciation 1,671.7 1,685.5
Impairment of property, plant and equipment 15.7 6.1
Amortisation of intangible assets 24.3 32.6
Aircraft maintenance and overhaul costs 402.8 342.4
Commission and incentives 402.8 316.5
Landing, parking and overflying charges 613.2 588.6
Handling charges 951.7 911.3
Rentals on leased aircraft 581.8 552.9
Material costs 223.9 220.4
Inflight meals 433.4 448.0
Advertising and sales costs 191.4 198.5
Insurance expenses 51.0 57.6
Company accommodation and utilities 112.8 105.7
Other passenger costs 145.4 130.4
Crew expenses 133.7 153.4
Other operating expenses 504.2 436.0
13,253.5 12,349.5
OPERATING PROFIT/(LOSS) 1,271.3 (12.6)
Finance charges (70.1) (65.6)
Interest income 37.3 49.3
Surplus on disposal of aircraft, spares and spare engines 103.3 25.4
Dividends from long-term investments 23.8 33.0
Other non-operating items 80.1 33.4
Share of profits of joint venture companies 74.6 56.1
Share of profits of associated companies 100.5 76.3
PROFIT BEFORE EXCEPTIONAL ITEMS 1,620.8 195.3
EXCEPTIONAL ITEMS (201.8) -
PROFIT BEFORE TAXATION 1,419.0 195.3
TAXATION (270.2) 12.2
PROFIT FOR THE FINANCIAL YEAR 1,148.8 207.5
PROFIT ATTRIBUTABLE TO:
OWNERS OF THE PARENT 1,092.0 157.3
NON-CONTROLLING INTERESTS 56.8 50.2
1,148.8 207.5
R5 SATS Group was deconsolidated from the Group with effect from 1 September 2009, after completion of the dividend
in specie distribution. For comparison purposes, a proforma consolidated profit and loss account for 2009-10 was prepared to
exclude the operations of SATS Group from 1 April to 31 August 2009.