Singapore Airlines 2011 Annual Report Download - page 135
Download and view the complete annual report
Please find page 135 of the 2011 Singapore Airlines annual report below. You can navigate through the pages in the report by either clicking on the pages listed below, or by using the keyword search tool below to find specific information within the annual report.-
 1
1 -
2
-
3
-
4
-
5
-
6
-
7
-
8
-
9
-
10
-
11
-
12
-
13
-
14
-
15
-
16
-
17
-
18
-
19
-
20
-
21
-
22
-
23
-
24
-
25
-
26
-
27
-
28
-
29
-
30
-
31
-
32
-
33
-
34
-
35
-
36
-
37
-
38
-
39
-
40
-
41
-
42
-
43
-
44
-
45
-
46
-
47
-
48
-
49
-
50
-
51
-
52
-
53
-
54
-
55
-
56
-
57
-
58
-
59
-
60
-
61
-
62
-
63
-
64
-
65
-
66
-
67
-
68
-
69
-
70
-
71
-
72
-
73
-
74
-
75
-
76
-
77
-
78
-
79
-
80
-
81
-
82
-
83
-
84
-
85
-
86
-
87
-
88
-
89
-
90
-
91
-
92
-
93
-
94
-
95
-
96
-
97
-
98
-
99
-
100
-
101
-
102
-
103
-
104
-
105
-
106
-
107
-
108
-
109
-
110
-
111
-
112
-
113
-
114
-
115
-
116
-
117
-
118
-
119
-
120
-
121
-
122
-
123
-
124
-
 125
125 -
 126
126 -
 127
127 -
 128
128 -
 129
129 -
 130
130 -
 131
131 -
 132
132 -
 133
133 -
 134
134 -
 135
135 -
 136
136 -
 137
137 -
 138
138 -
 139
139 -
 140
140 -
 141
141 -
 142
142 -
 143
143 -
 144
144 -
 145
145 -
146
-
147
-
148
-
149
-
150
-
151
-
152
-
153
-
154
-
155
-
156
-
157
-
158
-
159
-
160
-
161
-
162
-
163
-
164
-
165
-
166
-
167
-
168
-
169
-
170
-
171
-
172
-
173
-
174
-
175
-
176
-
177
-
178
-
179
-
180
-
181
-
182
-
183
-
184
-
185
-
186
-
187
-
188
-
189
-
190
-
191
-
192
-
193
-
194
-
195
-
196
-
197
-
198
-
199
-
200
-
201
-
202
-
203
-
204
-
205
-
206
-
207
-
208
 |
 |

ANNUAL REPORT 2010/2011 133
NOTES TO THE FINANCIAL STATEMENTS
31 March 2011
5 Staff Costs (in $ million) (continued)
Share-based compensation expense (continued)
Share-based incentive plans (continued)
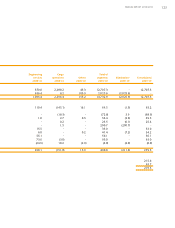
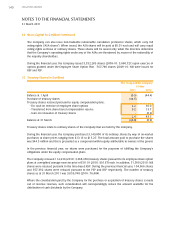
Movement of share awards during the financial year
Number of Restricted Shares
Balance at
1.4.2010/ Balance at
Date of grant date of grant Adjustment* Vested Cancelled 31.03.2011
RSP
27.7.2006 72,309 - (72,309) - -
1.8.2007 282,099 - (159,952) (5,219) 116,928
1.7.2008 722,623 (211,923) (279,575) (20,685) 210,440
29.7.2009 657,209 - - (22,400) 634,809
22.07.2010 547,300 - - (20,000) 527,300
2,281,540 (211,923) (511,836) (68,304) 1,489,477
* Adjustment at the end of two-year performance period upon meeting performance targets.
Number of Performance Shares
Balance at
1.4.2010/ Balance at
Date of grant date of grant Adjustment* Vested Cancelled 31.03.2011
PSP
1.8.2007 176,899 79,051 (255,950) - -
1.7.2008 248,864 - - (24,640) 224,224
29.7.2009 218,400 - - (24,640) 193,760
22.07.2010 177,400 - - (22,000) 155,400
821,563 79,051 (255,950) (71,280) 573,384
* Adjustment at the end of three-year performance period upon meeting performance targets.
Fair value of share awards granted
The fair value of services received in return for shares awarded is measured by reference to the fair value
of shares granted each year under the RSP and PSP. The estimate of the fair value of the services received
is measured based on a Monte Carlo simulation model, which involves projection of future outcomes using
statistical distributions of key random variables including share price and volatility of returns.