Singapore Airlines 2011 Annual Report Download - page 183
Download and view the complete annual report
Please find page 183 of the 2011 Singapore Airlines annual report below. You can navigate through the pages in the report by either clicking on the pages listed below, or by using the keyword search tool below to find specific information within the annual report.-
 1
1 -
2
-
3
-
4
-
5
-
6
-
7
-
8
-
9
-
10
-
11
-
12
-
13
-
14
-
15
-
16
-
17
-
18
-
19
-
20
-
21
-
22
-
23
-
24
-
25
-
26
-
27
-
28
-
29
-
30
-
31
-
32
-
33
-
34
-
35
-
36
-
37
-
38
-
39
-
40
-
41
-
42
-
43
-
44
-
45
-
46
-
47
-
48
-
49
-
50
-
51
-
52
-
53
-
54
-
55
-
56
-
57
-
58
-
59
-
60
-
61
-
62
-
63
-
64
-
65
-
66
-
67
-
68
-
69
-
70
-
71
-
72
-
73
-
74
-
75
-
76
-
77
-
78
-
79
-
80
-
81
-
82
-
83
-
84
-
85
-
86
-
87
-
88
-
89
-
90
-
91
-
92
-
93
-
94
-
95
-
96
-
97
-
98
-
99
-
100
-
101
-
102
-
103
-
104
-
105
-
106
-
107
-
108
-
109
-
110
-
111
-
112
-
113
-
114
-
115
-
116
-
117
-
118
-
119
-
120
-
121
-
122
-
123
-
124
-
125
-
126
-
127
-
128
-
129
-
130
-
131
-
132
-
133
-
134
-
135
-
136
-
137
-
138
-
139
-
140
-
141
-
142
-
143
-
144
-
145
-
146
-
147
-
148
-
149
-
150
-
151
-
152
-
153
-
154
-
155
-
156
-
157
-
158
-
159
-
160
-
161
-
162
-
163
-
164
-
165
-
166
-
167
-
168
-
169
-
170
-
171
-
172
-
 173
173 -
 174
174 -
 175
175 -
 176
176 -
 177
177 -
 178
178 -
 179
179 -
 180
180 -
 181
181 -
 182
182 -
 183
183 -
 184
184 -
 185
185 -
 186
186 -
 187
187 -
 188
188 -
 189
189 -
 190
190 -
 191
191 -
 192
192 -
 193
193 -
194
-
195
-
196
-
197
-
198
-
199
-
200
-
201
-
202
-
203
-
204
-
205
-
206
-
207
-
208
 |
 |

ANNUAL REPORT 2010/2011 181
NOTES TO THE FINANCIAL STATEMENTS
31 March 2011
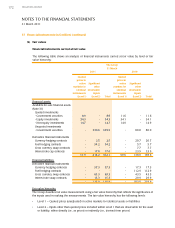
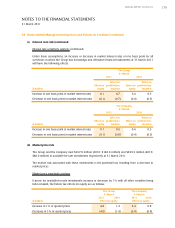
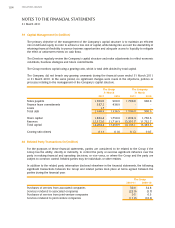
38 Financial Risk Management Objectives and Policies (in $ million) (continued)
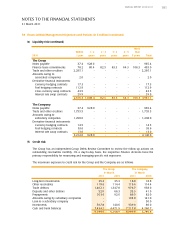
(e) Liquidity risk (continued)
More
Within 1 - 2 2 - 3 3 - 4 4 - 5 than
2010 1 year years years years years 5 years Total
The Group
Notes payable 37.4 928.0 - - - - 965.4
Finance lease commitments 78.2 80.4 82.5 83.3 64.3 106.3 495.0
Trade and other creditors 2,295.1 - - - - - 2,295.1
Amounts owing to
associated companies 2.0 - - - - - 2.0
Derivative financial instruments:
Currency hedging contracts 17.3 - - - - - 17.3
Fuel hedging contracts 112.9 - - - - - 112.9
Cross currency swap contracts 43.5 - - - - - 43.5
Interest rate swap contracts 29.9 - - - - - 29.9
2,616.3 1,008.4 82.5 83.3 64.3 106.3 3,961.1
The Company
Notes payable 37.4 928.0 - - - - 965.4
Trade and other creditors 1,755.5 - - - - - 1,755.5
Amounts owing to
subsidiary companies 1,298.0 - - - - - 1,298.0
Derivative financial instruments:
Currency hedging contracts 14.5 - - - - - 14.5
Fuel hedging contracts 93.6 - - - - - 93.6
Interest rate swap contracts 13.0 - - - - - 13.0
3,212.0 928.0 - - - - 4,140.0
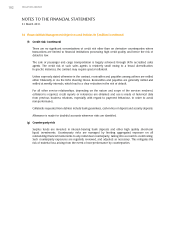
(f) Credit risk
The Group has an independent Group Debts Review Committee to review the follow up actions on
outstanding receivables monthly. On a day-to-day basis, the respective Finance divisions have the
primary responsibility for measuring and managing specific risk exposures.
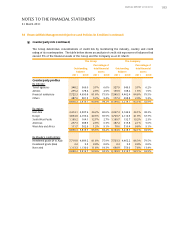
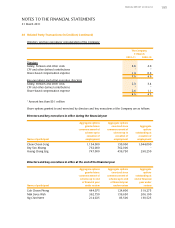
The maximum exposure to credit risk for the Group and the Company are as follows:
The Group The Company
31 March 31 March
2011 2010 2011 2010
Long-term investments 35.3 35.3 18.8 18.8
Other receivables 119.6 114.4 119.6 114.4
Trade debtors 1,402.1 1,347.8 976.7 958.0
Deposits and other debtors 52.0 66.3 33.5 41.9
Prepayments 103.6 92.6 89.5 82.0
Amounts owing by subsidiary companies - - 194.0 141.0
Loan to a subsidiary company - - - 50.0
Investments 397.8 140.6 339.9 80.0
Cash and bank balances 7,434.2 4,471.9 7,217.8 4,260.7
9,544.6 6,268.9 8,989.8 5,746.8