Singapore Airlines 2011 Annual Report Download - page 140
Download and view the complete annual report
Please find page 140 of the 2011 Singapore Airlines annual report below. You can navigate through the pages in the report by either clicking on the pages listed below, or by using the keyword search tool below to find specific information within the annual report.-
 1
1 -
2
-
3
-
4
-
5
-
6
-
7
-
8
-
9
-
10
-
11
-
12
-
13
-
14
-
15
-
16
-
17
-
18
-
19
-
20
-
21
-
22
-
23
-
24
-
25
-
26
-
27
-
28
-
29
-
30
-
31
-
32
-
33
-
34
-
35
-
36
-
37
-
38
-
39
-
40
-
41
-
42
-
43
-
44
-
45
-
46
-
47
-
48
-
49
-
50
-
51
-
52
-
53
-
54
-
55
-
56
-
57
-
58
-
59
-
60
-
61
-
62
-
63
-
64
-
65
-
66
-
67
-
68
-
69
-
70
-
71
-
72
-
73
-
74
-
75
-
76
-
77
-
78
-
79
-
80
-
81
-
82
-
83
-
84
-
85
-
86
-
87
-
88
-
89
-
90
-
91
-
92
-
93
-
94
-
95
-
96
-
97
-
98
-
99
-
100
-
101
-
102
-
103
-
104
-
105
-
106
-
107
-
108
-
109
-
110
-
111
-
112
-
113
-
114
-
115
-
116
-
117
-
118
-
119
-
120
-
121
-
122
-
123
-
124
-
125
-
126
-
127
-
128
-
129
-
 130
130 -
 131
131 -
 132
132 -
 133
133 -
 134
134 -
 135
135 -
 136
136 -
 137
137 -
 138
138 -
 139
139 -
 140
140 -
 141
141 -
 142
142 -
 143
143 -
 144
144 -
 145
145 -
 146
146 -
 147
147 -
 148
148 -
 149
149 -
 150
150 -
151
-
152
-
153
-
154
-
155
-
156
-
157
-
158
-
159
-
160
-
161
-
162
-
163
-
164
-
165
-
166
-
167
-
168
-
169
-
170
-
171
-
172
-
173
-
174
-
175
-
176
-
177
-
178
-
179
-
180
-
181
-
182
-
183
-
184
-
185
-
186
-
187
-
188
-
189
-
190
-
191
-
192
-
193
-
194
-
195
-
196
-
197
-
198
-
199
-
200
-
201
-
202
-
203
-
204
-
205
-
206
-
207
-
208
 |
 |

SINGAPORE AIRLINES
138
NOTES TO THE FINANCIAL STATEMENTS
31 March 2011
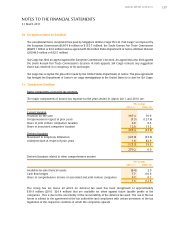
11 Taxation (in $ million) (continued)
A reconciliation between taxation expense and the product of accounting profit multiplied by the applicable
tax rate for the years ended 31 March is as follows:
The Group
2010-11 2009-10
Profit before taxation 1,419.0 285.5
Taxation at statutory corporate tax rate of 17.0% 241.2 48.5
Adjustments
Income not subject to tax (35.3) (48.3)
Expenses not deductible for tax purposes 67.0 35.7
Higher effective tax rates of other countries 6.1 7.6
Overprovision in respect of prior years, net (5.7) (44.7)
Income subject to concessionary tax rate (4.6) -
Tax benefit not recognised 1.7 6.3
Others (0.2) 0.9
Taxation 270.2 6.0
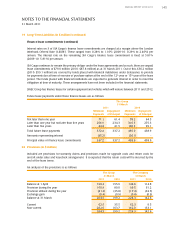
12 Earnings Per Share
The Group
2010-11 2009-10
Basic Diluted Basic Diluted
Profit attributable to owners of the Parent (in $ million) 1,092.0 1,092.0 215.8 215.8
Adjustment for dilutive potential ordinary shares
of subsidiary companies (in $ million) - (2.3) - (1.0)
Adjusted net profit attributable to owners of
the Parent (in $ million) 1,092.0 1,089.7 215.8 214.8
Weighted average number of ordinary shares
in issue (in million) 1,194.9 1,194.9 1,184.8 1,184.8
Adjustment for dilutive potential ordinary
shares (in million) - 13.3 - 11.7
Weighted average number of ordinary shares in issue
used for computing earnings per share (in million) 1,194.9 1,208.2 1,184.8 1,196.5
Earnings per share (cents) 91.4 90.2 18.2 18.0
Basic earnings per share is calculated by dividing the profit attributable to owners of the Parent by the
weighted average number of ordinary shares in issue during the financial year.
For purposes of calculating diluted earnings per share, the profit attributable to owners of the Parent is
adjusted to take into account effects of dilutive potential ordinary shares of subsidiary companies and the
weighted average number of ordinary shares of the Company in issue is adjusted to take into account
effects of dilutive options of the Company.
11.3 million (2009-10: 28.4 million) of the share options granted to employees under the existing employee
share option plans have not been included in the calculation of diluted earnings per share because they are
anti-dilutive for the current and previous years presented.