Singapore Airlines 2011 Annual Report Download - page 186
Download and view the complete annual report
Please find page 186 of the 2011 Singapore Airlines annual report below. You can navigate through the pages in the report by either clicking on the pages listed below, or by using the keyword search tool below to find specific information within the annual report.-
 1
1 -
2
-
3
-
4
-
5
-
6
-
7
-
8
-
9
-
10
-
11
-
12
-
13
-
14
-
15
-
16
-
17
-
18
-
19
-
20
-
21
-
22
-
23
-
24
-
25
-
26
-
27
-
28
-
29
-
30
-
31
-
32
-
33
-
34
-
35
-
36
-
37
-
38
-
39
-
40
-
41
-
42
-
43
-
44
-
45
-
46
-
47
-
48
-
49
-
50
-
51
-
52
-
53
-
54
-
55
-
56
-
57
-
58
-
59
-
60
-
61
-
62
-
63
-
64
-
65
-
66
-
67
-
68
-
69
-
70
-
71
-
72
-
73
-
74
-
75
-
76
-
77
-
78
-
79
-
80
-
81
-
82
-
83
-
84
-
85
-
86
-
87
-
88
-
89
-
90
-
91
-
92
-
93
-
94
-
95
-
96
-
97
-
98
-
99
-
100
-
101
-
102
-
103
-
104
-
105
-
106
-
107
-
108
-
109
-
110
-
111
-
112
-
113
-
114
-
115
-
116
-
117
-
118
-
119
-
120
-
121
-
122
-
123
-
124
-
125
-
126
-
127
-
128
-
129
-
130
-
131
-
132
-
133
-
134
-
135
-
136
-
137
-
138
-
139
-
140
-
141
-
142
-
143
-
144
-
145
-
146
-
147
-
148
-
149
-
150
-
151
-
152
-
153
-
154
-
155
-
156
-
157
-
158
-
159
-
160
-
161
-
162
-
163
-
164
-
165
-
166
-
167
-
168
-
169
-
170
-
171
-
172
-
173
-
174
-
175
-
 176
176 -
 177
177 -
 178
178 -
 179
179 -
 180
180 -
 181
181 -
 182
182 -
 183
183 -
 184
184 -
 185
185 -
 186
186 -
 187
187 -
 188
188 -
 189
189 -
 190
190 -
 191
191 -
 192
192 -
 193
193 -
 194
194 -
 195
195 -
 196
196 -
197
-
198
-
199
-
200
-
201
-
202
-
203
-
204
-
205
-
206
-
207
-
208
 |
 |

SINGAPORE AIRLINES
184
NOTES TO THE FINANCIAL STATEMENTS
31 March 2011
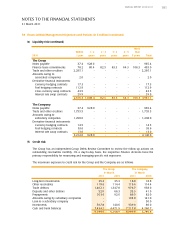
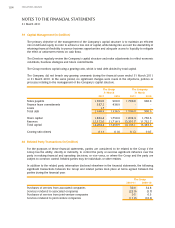
39 Capital Management (in $ million)
The primary objective of the management of the Company’s capital structure is to maintain an efficient
mix of debt and equity in order to achieve a low cost of capital, while taking into account the desirability of
retaining financial flexibility to pursue business opportunities and adequate access to liquidity to mitigate
the effect of unforeseen events on cash flows.
The Directors regularly review the Company’s capital structure and make adjustments to reflect economic
conditions, business strategies and future commitments.
The Group monitors capital using a gearing ratio, which is total debt divided by total capital.
The Company did not breach any gearing covenants during the financial years ended 31 March 2011
or 31 March 2010. In the same period, no significant changes were made in the objectives, policies or
processes relating to the management of the Company’s capital structure.
The Group The Company
31 March 31 March
2011 2010 2011 2010
Notes payable 1,700.0 900.0 1,700.0 900.0
Finance lease commitments 337.2 438.9 - -
Loans 1.7 - - -
Total debt 2,038.9 1,338.9 1,700.0 900.0
Share capital 1,832.4 1,750.6 1,832.4 1,750.6
Reserves 12,372.0 11,718.3 12,302.7 11,732.7
Total capital 14,204.4 13,468.9 14,135.1 13,483.3
Gearing ratio (times) 0.14 0.10 0.12 0.07
40 Related Party Transactions (in $ million)
For the purposes of these financial statements, parties are considered to be related to the Group if the
Group has the ability, directly or indirectly, to control the party or exercise significant influence over the
party in making financial and operating decisions, or vice versa, or where the Group and the party are
subject to common control. Related parties may be individuals or other entities.
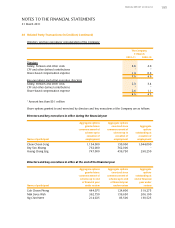
In addition to the related party information disclosed elsewhere in the financial statements, the following
significant transactions between the Group and related parties took place at terms agreed between the
parties during the financial year:
The Group
2010-11 2009-10
Purchases of services from associated companies 30.0 34.8
Services rendered to associated companies (23.0) (5.7)
Purchases of services from joint venture companies 0.5 0.3
Services rendered to joint venture companies (11.9) (10.3)