Qantas 2008 Annual Report Download - page 99
Download and view the complete annual report
Please find page 99 of the 2008 Qantas annual report below. You can navigate through the pages in the report by either clicking on the pages listed below, or by using the keyword search tool below to find specific information within the annual report.-
 1
1 -
2
-
3
-
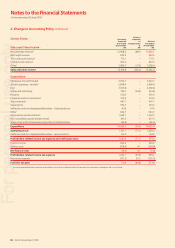
4
-
5
-
6
-
7
-
8
-
9
-
10
-
11
-
12
-
13
-
14
-
15
-
16
-
17
-
18
-
19
-
20
-
21
-
22
-
23
-
24
-
25
-
26
-
27
-
28
-
29
-
30
-
31
-
32
-
33
-
34
-
35
-
36
-
37
-
38
-
39
-
40
-
41
-
42
-
43
-
44
-
45
-
46
-
47
-
48
-
49
-
50
-
51
-
52
-
53
-
54
-
55
-
56
-
57
-
58
-
59
-
60
-
61
-
62
-
63
-
64
-
65
-
66
-
67
-
68
-
69
-
70
-
71
-
72
-
73
-
74
-
75
-
76
-
77
-
78
-
79
-
80
-
81
-
82
-
83
-
84
-
85
-
86
-
87
-
88
-
 89
89 -
 90
90 -
 91
91 -
 92
92 -
 93
93 -
 94
94 -
 95
95 -
 96
96 -
 97
97 -
 98
98 -
 99
99 -
 100
100 -
 101
101 -
 102
102 -
 103
103 -
 104
104 -
 105
105 -
 106
106 -
 107
107 -
 108
108 -
 109
109 -
110
-
111
-
112
-
113
-
114
-
115
-
116
-
117
-
118
-
119
-
120
-
121
-
122
-
123
-
124
-
125
-
126
-
127
-
128
-
129
-
130
-
131
-
132
-
133
-
134
-
135
-
136
-
137
-
138
-
139
-
140
-
141
-
142
-
143
-
144
-
145
-
146
-
147
-
148
-
149
-
150
-
151
-
152
-
153
-
154
-
155
-
156
 |
 |

97 Qantas Annual Report 2008
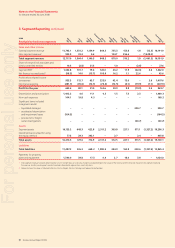
Notes to the Financial Statements
for the year ended 30 June 2008
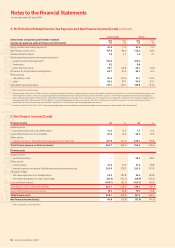
Qantas
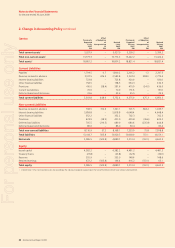
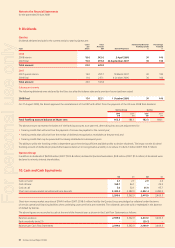
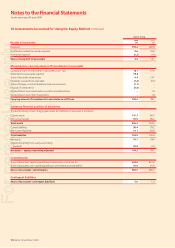
Dividends declared and paid in the current and prior year by Qantas are:
Type
Cents
per
Share
Total
Amount
$M Date of Payment
Franked Tax Rate for
Franking Credit
%
Percentage
Franked
%
2008
2008 interim 18.0 342.0 2 April 2008 30 100
2007 fi nal 15.0 297.8 26 September 2007 30 100
Total amount 33.0 639.8
2007
2007 special interim 15.0 297.7 19 March 2007 30 100
2006 fi nal 11.0 215.1 4 October 2006 30 100
Total amount 26.0 512.8
Subsequent events
The following dividends were declared by the Directors after the balance date and a provision has not yet been raised:
2008 final 17.0 322.1 1 October 2008 30 100
On 21 August 2008, the Board approved the reinstatement of the DRP with effect from the payment of the 30 June 2008 fi nal dividend.
Qantas Group Qantas
2008
$M
2007
$M
2008
$M
2007
$M
Total franking account balance at 30 per cent 162.3 184.1 162.3 184.1
The above amount represents the balance of the franking accounts as at year end, after taking into account adjustments for:
franking credits that will arise from the payment of income tax payable for the current year;
franking credits that will arise from the receipt of dividends recognised as receivables at the year end; and
franking credits that may be prevented from being distributed in subsequent years.
The ability to utilise the franking credits is dependent upon there being suffi cient available profi ts to declare dividends. The impact on the dividend
franking account of dividends proposed after balance date but not recognised as a liability is to reduce it to $24.2 million (2007: $56.5 million).
Qantas Group
In addition to dividends of $639.8 million (2007: $512.8 million) declared to Qantas shareholders, $0.8 million (2007: $1.0 million) of dividends were
declared to minority interest shareholders.
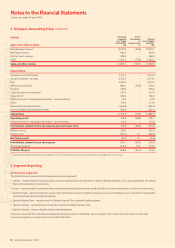
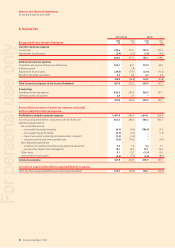
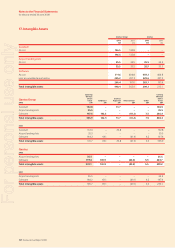
10. Cash and Cash Equivalents
$M $M $M $M
Cash on hand 3.1 2.7 2.9 2.6
Cash at bank 168.7 46.1 –29.0
Cash at call 5.0 32.1 35.9 95.7
Short-term money market securities and term deposits 2,422.2 3,282.0 2,422.2 3,282.0
2,599.0 3,362.9 2,461.0 3,409.3
Short-term money market securities of $164.0 million (2007: $198.0 million) held by the Qantas Group are pledged as collateral under the terms
of certain operational fi nancing facilities when underlying unsecured limits are exceeded. The collateral cannot be sold or repledged in the absence
of default by Qantas.
The above fi gures are reconciled to cash at the end of the fi nancial year as shown in the Cash Flow Statements as follows:
Balances as above 2,599.0 3,362.9 2,461.0 3,409.3
Bank overdrafts (note 21) ––(20.1) –
Balances per Cash Flow Statements 2,599.0 3,362.9 2,440.9 3,409.3
•
•
•
9. Dividends
For personal use only