Qantas 2008 Annual Report Download - page 141
Download and view the complete annual report
Please find page 141 of the 2008 Qantas annual report below. You can navigate through the pages in the report by either clicking on the pages listed below, or by using the keyword search tool below to find specific information within the annual report.-
 1
1 -
2
-
3
-
4
-
5
-
6
-
7
-
8
-
9
-
10
-
11
-
12
-
13
-
14
-
15
-
16
-
17
-
18
-
19
-
20
-
21
-
22
-
23
-
24
-
25
-
26
-
27
-
28
-
29
-
30
-
31
-
32
-
33
-
34
-
35
-
36
-
37
-
38
-
39
-
40
-
41
-
42
-
43
-
44
-
45
-
46
-
47
-
48
-
49
-
50
-
51
-
52
-
53
-
54
-
55
-
56
-
57
-
58
-
59
-
60
-
61
-
62
-
63
-
64
-
65
-
66
-
67
-
68
-
69
-
70
-
71
-
72
-
73
-
74
-
75
-
76
-
77
-
78
-
79
-
80
-
81
-
82
-
83
-
84
-
85
-
86
-
87
-
88
-
89
-
90
-
91
-
92
-
93
-
94
-
95
-
96
-
97
-
98
-
99
-
100
-
101
-
102
-
103
-
104
-
105
-
106
-
107
-
108
-
109
-
110
-
111
-
112
-
113
-
114
-
115
-
116
-
117
-
118
-
119
-
120
-
121
-
122
-
123
-
124
-
125
-
126
-
127
-
128
-
129
-
130
-
 131
131 -
 132
132 -
 133
133 -
 134
134 -
 135
135 -
 136
136 -
 137
137 -
 138
138 -
 139
139 -
 140
140 -
 141
141 -
 142
142 -
 143
143 -
 144
144 -
 145
145 -
 146
146 -
 147
147 -
 148
148 -
 149
149 -
 150
150 -
 151
151 -
152
-
153
-
154
-
155
-
156
 |
 |

139 Qantas Annual Report 2008
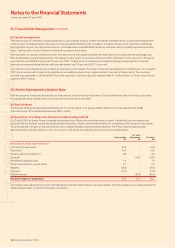
Notes to the Financial Statements
for the year ended 30 June 2008
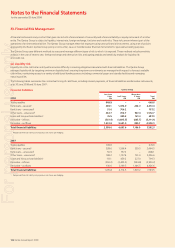
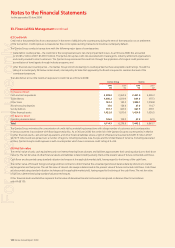
The following table summarises the impact of reasonably possible changes in foreign exchange rates on net profi t and equity. For the purpose of
this disclosure, the sensitivity analysis assumes a 10% increase and decrease in all currency pairs. Sensitivity analysis assumes designations and hedge
effectiveness testing results as at 30 June 2008 remains unchanged. This analysis also assumes that all other variables, including interest rates,
remain constant.
Qantas Group Qantas
Net profi tEquity Net profi tEquity
2008
$M
2007
$M
2008
$M
2007
$M
2008
$M
2007
$M
2008
$M
2007
$M
10% increase in all currency pairs (31.7) (23.3) (548.5) (391.3) (31.7) (23.3) (549.0) (393.6)
10% decrease in all currency pairs 42.5 32.5 703.8 530.1 42.5 32.5 704.4 532.9
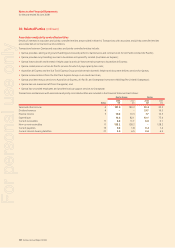
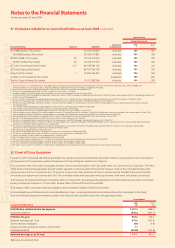
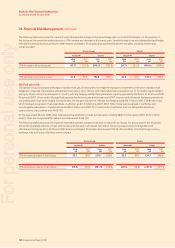
(iii) Fuel price risk
The Qantas Group uses options and swaps on aviation fuel, gas oil and crude oil to hedge the exposure to movements in the price of aviation fuel.
Hedging is conducted in accordance with Qantas Group policy. Up to 100 per cent of estimated fuel consumption out to 12 months may be hedged
and up to 50 per cent in the subsequent 12 months, with any hedging outside these parameters requiring approval by the Board. As at 30 June 2008,
65 per cent (2007: 59 per cent) of forecast fuel exposure less than one year and two per cent (2007: two per cent) of forecast fuel exposure between
one and fi ve years have been hedged. During the year, the net gain arising from effective fuel hedging was $474.7 million (2007: $39.8 million loss)
which has been recognised in fuel expenditure. In addition, an $11.3 million loss (2007: $59.7 million (loss)) was recognised in ineffective and
non-designated derivatives – closed positions and $36.9 million loss (2007: $11.5 million loss) in ineffective and non-designated derivatives –
open positions in accordance with AASB 139.
For the year ended 30 June 2008, other fi nancial assets and liabilities include fuel derivatives totalling $840.4 million (asset) (2007: $129.3 million
(asset)). These are recognised at fair value in accordance with AASB 139.
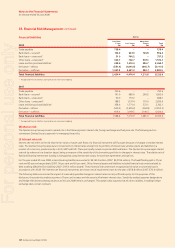
The following table summarises the impact of reasonably possible changes in fuel price on net profi t and equity. For the purpose of this disclosure,
the sensitivity analysis assumes a 10 per cent increase and decrease in all relevant fuel indices. Sensitivity analysis assumes designation and
effectiveness testing results as at 30 June 2008 remains unchanged. This analysis also assumes that all other variables, including foreign currency
exchange rates and option volatilities remain constant.
Qantas Group Qantas
Net profi tEquity Net profi tEquity
2008
$M
2007
$M
2008
$M
2007
$M
2008
$M
2007
$M
2008
$M
2007
$M
10% increase per barrel in fuel indices 32.2 18.9 254.7 149.4 32.2 18.9 254.7 149.9
10% decrease per barrel in fuel indices (29.3) (16.9) (231.9) (133.9) (29.3) (16.9) (231.9) (133.9)
33. Financial Risk Management continued
For personal use only