Qantas 2008 Annual Report Download - page 143
Download and view the complete annual report
Please find page 143 of the 2008 Qantas annual report below. You can navigate through the pages in the report by either clicking on the pages listed below, or by using the keyword search tool below to find specific information within the annual report.-
 1
1 -
2
-
3
-
4
-
5
-
6
-
7
-
8
-
9
-
10
-
11
-
12
-
13
-
14
-
15
-
16
-
17
-
18
-
19
-
20
-
21
-
22
-
23
-
24
-
25
-
26
-
27
-
28
-
29
-
30
-
31
-
32
-
33
-
34
-
35
-
36
-
37
-
38
-
39
-
40
-
41
-
42
-
43
-
44
-
45
-
46
-
47
-
48
-
49
-
50
-
51
-
52
-
53
-
54
-
55
-
56
-
57
-
58
-
59
-
60
-
61
-
62
-
63
-
64
-
65
-
66
-
67
-
68
-
69
-
70
-
71
-
72
-
73
-
74
-
75
-
76
-
77
-
78
-
79
-
80
-
81
-
82
-
83
-
84
-
85
-
86
-
87
-
88
-
89
-
90
-
91
-
92
-
93
-
94
-
95
-
96
-
97
-
98
-
99
-
100
-
101
-
102
-
103
-
104
-
105
-
106
-
107
-
108
-
109
-
110
-
111
-
112
-
113
-
114
-
115
-
116
-
117
-
118
-
119
-
120
-
121
-
122
-
123
-
124
-
125
-
126
-
127
-
128
-
129
-
130
-
131
-
132
-
 133
133 -
 134
134 -
 135
135 -
 136
136 -
 137
137 -
 138
138 -
 139
139 -
 140
140 -
 141
141 -
 142
142 -
 143
143 -
 144
144 -
 145
145 -
 146
146 -
 147
147 -
 148
148 -
 149
149 -
 150
150 -
 151
151 -
 152
152 -
 153
153 -
154
-
155
-
156
 |
 |

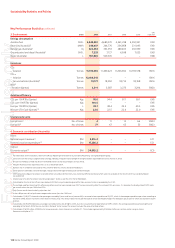
141 Qantas Annual Report 2008
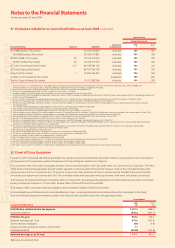
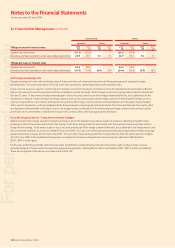
Notes to the Financial Statements
for the year ended 30 June 2008
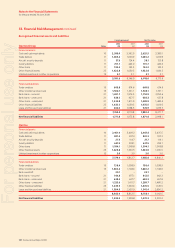
Recognised financial assets and liabilities
Carrying amount Net fair value
Qantas Group Notes
2008
$M
2007
$M
2008
$M
2007
$M
Financial assets
Cash and cash equivalents 10 2,599.0 3,362.9 2,625.5 3,389.1
Trade debtors 11 1,085.2 1,039.9 1,085.2 1,039.9
Aircraft security deposits 11 37.6 124.4 38.1 125.8
Sundry debtors 11 701.7 443.0 701.7 443.0
Other loans 11 142.2 142.2 142.2 142.2
Other fi nancial assets 25 1,422.8 1,030.5 1,422.8 1,030.5
Unlisted investment in other corporations 15 3.1 3.1 3.1 3.1
5,991.6 6,146.0 6,018.6 6,173.6
Financial liabilities
Trade creditors 19 669.8 674.6 669.8 674.6
Other creditors and accruals 19 1,504.1 1,331.1 1,504.1 1,331.1
Bank loans – secured 21 1,691.7 1,976.5 1,753.9 2,052.6
Bank loans – unsecured 21 628.5 627.7 658.3 657.8
Other loans – unsecured 21 1,233.8 1,411.9 1,289.9 1,480.4
Other fi nancial liabilities 25 1,435.5 1,039.5 1,435.5 1,039.5
Lease and hire purchase liabilities 21 606.0 1,058.5 578.9 1,035.7
7,769.4 8,119.8 7,890.4 8,271.7
Net financial liabilities 1,777.8 1,973.8 1,871.8 2,098.1
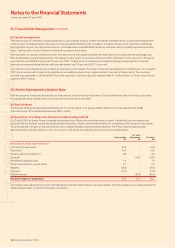
Qantas
Financial assets
Cash and cash equivalents 10 2,461.0 3,409.3 2,467.4 3,435.5
Trade debtors 11 841.3 937.3 841.3 937.3
Aircraft security deposits 11 27.3 114.7 27.7 116.1
Sundry debtors 11 627.5 299.1 627.5 299.1
Other loans 11 1,994.1 1,018.8 1,994.1 1,018.8
Other fi nancial assets 25 1,424.8 1,030.5 1,424.8 1,030.5
Unlisted investment in other corporations 15 3.0 3.0 3.0 3.0
7,379.0 6,812.7 7,385.8 6,840.3
Financial liabilities
Trade creditors 19 738.4 1,098.9 738.4 1,098.9
Other creditors and accruals 19 1,860.2 1,108.6 1,860.2 1,108.6
Bank overdraft 20.1 –20.1 –
Bank loans – secured 21 760.8 877.1 812.5 942.3
Bank loans – unsecured 21 628.5 627.7 658.3 657.8
Other loans – unsecured 21 1,233.6 1,411.7 1,289.7 1,480.2
Other fi nancial liabilities 25 1,435.5 1,036.6 1,435.5 1,149.5
Lease and hire purchase liabilities 21 1,984.9 2,651.9 1,941.4 2,606.2
8,662.0 8,812.5 8,756.1 9,043.5
Net financial liabilities 1,283.0 1,999.8 1,370.3 2,203.2
33. Financial Risk Management continued
For personal use only