Qantas 2008 Annual Report Download - page 79
Download and view the complete annual report
Please find page 79 of the 2008 Qantas annual report below. You can navigate through the pages in the report by either clicking on the pages listed below, or by using the keyword search tool below to find specific information within the annual report.-
 1
1 -
2
-
3
-
4
-
5
-
6
-
7
-
8
-
9
-
10
-
11
-
12
-
13
-
14
-
15
-
16
-
17
-
18
-
19
-
20
-
21
-
22
-
23
-
24
-
25
-
26
-
27
-
28
-
29
-
30
-
31
-
32
-
33
-
34
-
35
-
36
-
37
-
38
-
39
-
40
-
41
-
42
-
43
-
44
-
45
-
46
-
47
-
48
-
49
-
50
-
51
-
52
-
53
-
54
-
55
-
56
-
57
-
58
-
59
-
60
-
61
-
62
-
63
-
64
-
65
-
66
-
67
-
68
-
 69
69 -
 70
70 -
 71
71 -
 72
72 -
 73
73 -
 74
74 -
 75
75 -
 76
76 -
 77
77 -
 78
78 -
 79
79 -
 80
80 -
 81
81 -
 82
82 -
 83
83 -
 84
84 -
 85
85 -
 86
86 -
 87
87 -
 88
88 -
 89
89 -
90
-
91
-
92
-
93
-
94
-
95
-
96
-
97
-
98
-
99
-
100
-
101
-
102
-
103
-
104
-
105
-
106
-
107
-
108
-
109
-
110
-
111
-
112
-
113
-
114
-
115
-
116
-
117
-
118
-
119
-
120
-
121
-
122
-
123
-
124
-
125
-
126
-
127
-
128
-
129
-
130
-
131
-
132
-
133
-
134
-
135
-
136
-
137
-
138
-
139
-
140
-
141
-
142
-
143
-
144
-
145
-
146
-
147
-
148
-
149
-
150
-
151
-
152
-
153
-
154
-
155
-
156
 |
 |

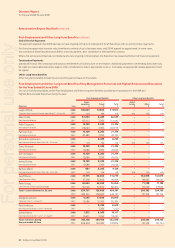
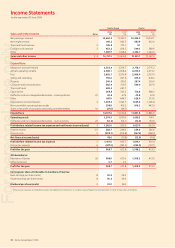
77 Qantas Annual Report 2008
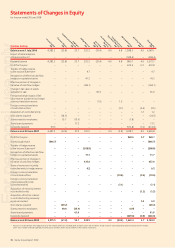
Statements of Changes in Equity continued
for the year ended 30 June 2008
Qantas
Balance as at 1 July 2006 4,382.2 (23.8) 23.7 332.2 672.2 5,386.5
Impact of initial adoption of Interpretation 13 – – – – (505.8) (505.8)
Restated balance 4,382.2 (23.8) 23.7 332.2 166.4 4,880.7
Profi t for the year – – – – 413.3 413.3
Transfer of hedge reserve to the Income Statement1– – –9.7 –9.7
Recognition of effective cash fl ow hedges on
capitalised assets – – – 41.2 – 41.2
Effective portion of changes in fair value
of cash fl ow hedges – – –(261.5) –(261.5)
Own shares acquired –(24.5)–––(24.5)
Shares vested to employees – 15.7 (13.9) – (1.8) –
Share-based payments ––17.2––17.2
Dividends declared 99.0 – – – (512.8) (413.8)
Balance as at 30 June 2007 4,481.2 (32.6) 27.0 121.6 65.1 4,662.3
Profi t for the year ––––1,308.21,308.2
Shares bought back (505.7) – – – – (505.7)
Transfer of hedge reserve to the Income Statement1– – – (208.8) – (208.8)
Recognition of effective cash fl ow hedges on
capitalised assets –––71.7–71.7
Effective portion of changes in fair value
of cash fl ow hedges – – – 437.2 – 437.2
Own shares acquired –(69.2)–––(69.2)
Shares vested to employees –40.8(35.9) – (4.9) –
Share-based payments – – 61.6 – – 61.6
Dividends declared ––––(639.8)(639.8)
Balance as at 30 June 2008 3,975.5 (61.0) 52.7 421.7 728.6 5,117.5
Amounts transferred from the hedge reserve to the Income Statements totalled $208.8 million (2007: ($9.7) million). These amounts were allocated to revenue (2008: ($124.7) million;
2007: $18.1 million) and fuel expenditure (2008: $333.5 million; 2007: ($27.8) million) in the Income Statements.
1
Issued Capital
$M
Treasury Shares
$M
Employee
Compensation Reserve
$M
Hedge Reserve
$M
Retained Earnings
$M
Total Equity
$M
For personal use only